The sun’s light and energy sustain the life of plants and all microbes and animals that live off plants. As background information to the 5000 years project, this article describes how the light and energy reaching the earth depend on time of day, time in the year, latitude and the highly variable cloud cover typical of the north Atlantic region.
Anyone wishing to understand food production in the croplands of the maritime north Atlantic has to understand the importance of the yearly solar cycle. Questions as to why certain crops dominate, why each cropping season is a challenge, why cropping is still diverse and why yields remain high, can only be answered through knowledge of the solar cycle and its interactions with cloud, rain, temperature, soil and people.
Topics include –
- direction and height of the sun – azimuth and elevation
- change of direction and height with latitude
- the sun’s energy
- the day’s course
- the year’s cycle
- years differ
- anything good about the weather?
- further information and contacts
Direction and height of the sun – azimuth and elevation
The two features that define the sun’s position as seen from any place on earth are its azimuth – the direction it shines from – and its elevation or height (Fig. 1). The azimuth is measured as an angle in a 360-degree circle, starting at north (0 degrees), moving right or clockwise through east (90), south (180), west (270) and back to north. The elevation or height of the sun is measured at the angle from the horizontal upwards.
Anyone who arranges a plant in a garden or a seat to catch the evening light knows about azimuth and elevation. The annual cycle of cropping is timed by them. Cathedrals and humble churches were built with precise knowledge of them, as were ancient stone henges and alignments.
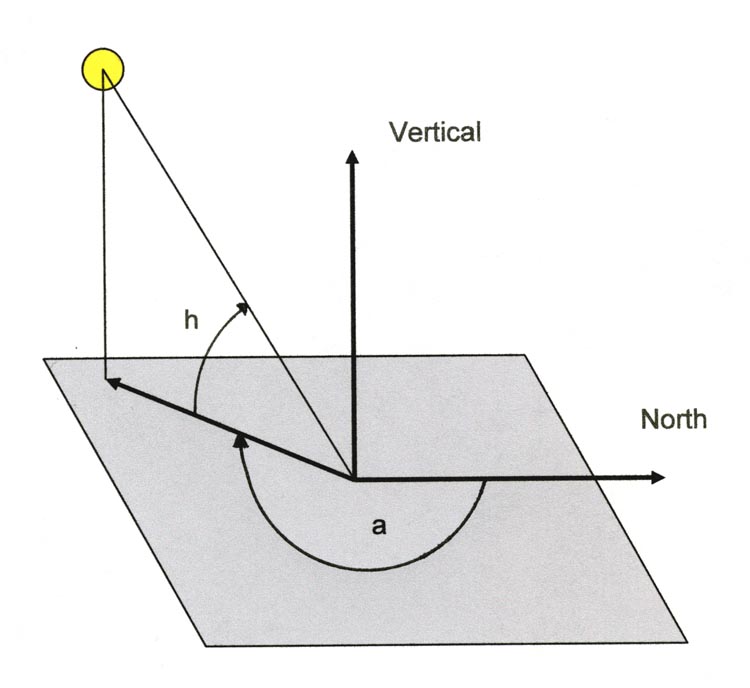
Fig. 1. The position of the sun, shown by the yellow disc, is defined at any time by its azimuth (a) – the angle measured clockwise from north; and its elevation or height – the angle (h) up from the horizontal.
The elevation and azimuth change throughout every day, with the seasons and with latitude – the distance north or south from the equator. The variation in azimuth and elevation throughout the year at the Institute’s research farm near Dundee (latitude 56 28 north, longitude 3 07 west) is shown in Fig. 2 (below). The azimuth lies along the horizontal axis, and goes from 0 which is north, clockwise through east, south, west and back to north. (Imagine this as circle that’s been unwound into a line.) The elevation goes from 0 degrees at sunrise and sunset to a maximum of around 57 degrees when the sun is highest. If the sun were directly overhead, it would be 90 degrees but that does not happen this far north.
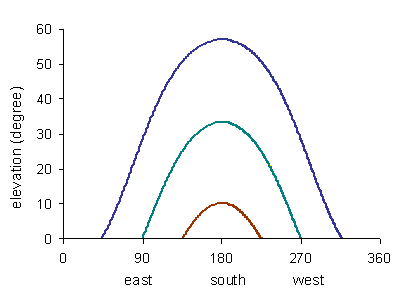
Fig. 2. Change in the sun’s elevation and azimuth (shown on the horizontal axis – the angle from the north, clockwise, through east, south and west) on three days: the summer solstice (longest day, 21 June, upper curve), the equinox (around 21 March or 21 September, middle) and the winter solstice (shortest day, 21 December, lower) at latitude 56 N.
In the examples shown in Fig. 2, sunrise and sunset occur when the traces are near zero. At the equinox, the sunrise is due east and sunset due west. At the shortest day, sunrise and sunset are much nearer south and at the longest day much nearer north. The time for which the sun is above the horizon and potentially visible at this latitude is 12 hours at the equinoxes, just less than 17 and three-quarter hours on the longest day and about 6 and three-quarter hours on the shortest day.
[Note. The astronomical reasons why the sun’s azimuth and elevation change with time of day and year are not described here but can be found in web sites and books listed under Further information below.]
Change of direction and height with latitude
Imagine the first farmers in the neolithic (late stone age) migrating north from southern Europe through what is now Brittany, Ireland, Argyll and on to Orkney and Shetland. They would have adapted to the annual change in the sun’s height and direction at any place, but they would also have noticed that these things did not stay the same as they moved north. The sun got lower in the sky but it remained longer above the horizon.
These changes are shown for two latitudes (Fig. 3). At Lerwick in Shetland, the maximum height of the sun in summer is about 20% or a fifth smaller than at Carnac in the Golfe de Morbihan in Brittany. But the sun is above the horizon at the summer solstice for 18 hours 45 minutes at Lerwick compared to 15 hours 30 minutes at Carnac. At the site of the neolithic settlements at Bru na Boine north of Dublin, Ireland, the curve is mid-way between the two shown. Every degree change in latitude alters the sun’s maximum height by just over a degree, so between Dumfries and Lerwick, for example, the maximum height of the sun decreases by about 10%. Over the latitudes covered by Scotland, therefore, the changes in height and direction are quite small compared to the changes at any place through the year.
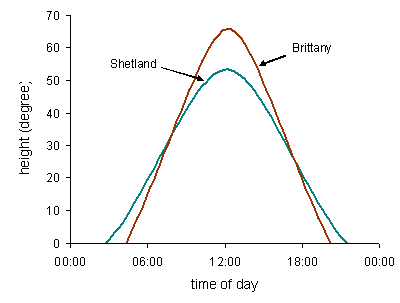
Fig. 3. Change in the sun’s elevation (height) throughout the day on the longest day, 21 June (2010), at Carnac in the Golfe de Morbihan, Brittany at latitude 47.58 N (degree, decimal ) and at Lerwick, Shetland at latitude 60.15 N.
What do these changes mean for plants and people? They determine the period each day when people can work or travel outside without light. The length of the light period is also a signal that tells some plant and animals the time of year. For example, some plants begin flowering only when the light period is a certain length. In addition to affecting the period of light, the changes in azimuth and elevation cause big changes in the solar energy reaching the earth. Solar energy has a strong effect on temperature and also drives the growth of plants.
The sun’s energy
The changes of the sun’s elevation and azimuth are particularly important for the growth of plants, since they set the limit for the total amount of solar energy that the plants can trap to absorb carbon dioxide from the air and the distribution of this energy through the day and year.
In northern, temperate latitudes, the seasonal change in the intensity of the sun’s energy is the climatic factor that most strongly determines the growth of crops and most other plants and so the animals that depend on them. Although we take it for granted, it is the large difference in the energy received between the winter and summer that determines which vegetation can grow here, and the yield of that vegetation, whether grain, oil or wood. This is not so everywhere – in the tropics, for example, the solar energy changes much less through the year and other factors, notably cloud cover and rainfall, have the strongest seasonal effects on plants.
So how is the sun’s energy determined by azimuth and elevation? First – some definitions and units of energy.
- Unit of energy – the joule, J.
- Flow of energy in time – joule per second, J s-1 or watt (W).
- Irradiance – flow of solar energy per unit time per unit area – watts per square metre, W m-2 (J m-2 s-1)
- Irradiance ‘accumulated’ over time – J m-2 (joules per square metre), but because the amounts of solar energy are so large, the totals for a day are normally expressed in MJ m-2 (megajoules per square metre; M or mega = million) and those for a year in GJ m-2 (gigajoules per square metre, G = 1000 million).
Another factor that has to be taken into account when measuring solar energy is the wavelength. Solar energy includes a range of wavelengths, together termed short-wave radiation to distinguish them from the much longer wavelengths emitted by cooler objects such as buildings, plants and soil. Perhaps the commonest measurement is of the whole spectrum of wavelengths from the sun (here named total solar radiation or total irradiance). The total irradiance received from the sun on a unit area of (horizontal) surface is measured by an instrument called a solarimeter. This is positioned exactly horizontally and records the direct beam and any downward reflection or diffraction of sunlight from clouds. This total irradiance is what is presented in the graphs below.
[Note. In many biological studies, specific parts of the total solar spectrum need to be measured. Plant leaves trap much of the solar spectrum, but only a portion of it is actually used in photosynthesis. This photosynthetically active radiation comes to about half the total. Certain other biological processes in plants and animals are sensitive to a much smaller range of wavelength.]
The day’s course
The intensity of energy – the irradiance – received on plant leaves, animal skin, soil, water or rock, is determined mostly by the elevation of the sun in relation to the angle of the object. The change in irradiance throughout a clear day looks much like a change in elevation in Fig. 2, except near sunrise and sunset. At these times, a sensitive solarimeter will still record energy for a few minutes when the sun is below the horizon. Many animals including humans can still ‘see’ the very low levels of solar energy for some time after sunset.
The irradiance and the cumulative energy measured by a solarimeter during a mostly cloudless day near the summer solstice are compared in Fig. 4. The irradiance is seen to rise and fall just like the upper curve of elevation changes through the day in Fig. 2. Leaves on plants would not be harmed by the peak irradiance, so long as they could draw up water from the soil to cool themselves, but humans exposing their skin for a couple of hours at the peak would get sunburn. The cumulative value of the energy increases throughout the day until the sun sets. The final cumulative value on the right hand axis of Fig. 4, when the blue curve levels off, was 22.8 MJ m-2 on this day.
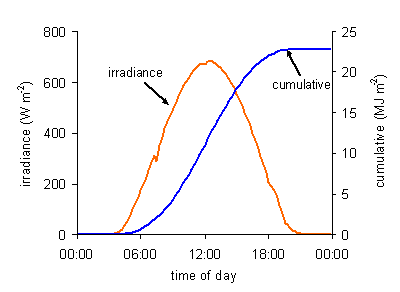
Fig. 4. Solar irradiance (orange, left axis) and cumulative solar energy received (blue, right axis) at the earth’s surface throughout a mostly clear day in late May.
The peak and the maximum cumulative energy can both get a bit higher than shown in Fig. 4, for example on clear days in late June, but they get very much lower in winter. The peak irradiance decreases by about 10% between the Borders and Shetland (just like the decrease in maximum elevation, see above). The extra length of day going north does not compensate for this entirely, so the solar radiation received between sunrise and sunset on a clear day falls as you move north.
The year’s cycle
The daily solar energy rises from a low in December to a high in June and then falls back to the low (Fig. 5). This annual pattern of the solar energy received each day takes on a generally similar shape every year, but no two years are the same.
The change in the sun’s azimuth and elevation (which vary with latitude) cause the underlying rise and fall at each place. Outside the earth’s atmosphere, the annual cycle of solar energy would be recorded as a smooth curve. But at the earth’s surface itself, on rocks and plants and people, the variation among days is enormous due to cloud and haze.
A very important characteristic of the solar energy received in the north Atlantic region is not just the enormous variation between the high of summer and the low of winter, but this enormous variation betweeen nearby days caused by differences in cloud. In the year shown in Fig. 5, the energy income ranged from 30 MJ m-2 to 4 MJ m-2 on different days in June.
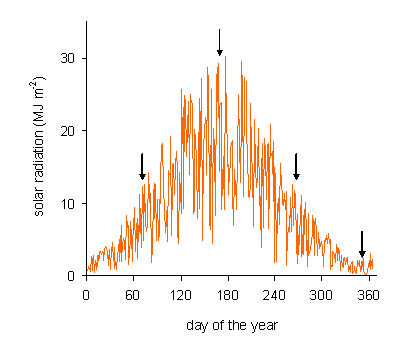
Fig. 5. Daily totals of solar radiation received at the earth’s surface, as measured by a solarimeter at the James Hutton Institute (latitude 56 N), over the course of a year from 1 January (day = 0) to 31 December (day = 365). The arrows show, left to right, the spring equinox, the summer solstice, the autumn equinox and the winter solstice.
The variation in solar energy received over a run of days or weeks is one of the factors that describe a weather-pattern. (Others include temperature, wind and rainfall.) There are hot sunny days in the north Atlantic, but they are not that common. What most people feel as a hot sunny day in mid-summer gets more than 20 MJ m-2. A really hot day gets more than 25 MJ m-2, and in most years in the last 10, there weren’t many twenty-five-megajoule days, maybe as few as half a dozen in some years. Gardeners, farmers, people on holiday, and people who just built sitooteries, know, if the weather is fine at all – it won’t last. When cloudy days were dished out, the maritime north Atlantic got more than its fair share.
Years differ
The annual trace of incoming energy, of the type in Fig. 5, is shown for four years one after the other in Fig. 6. The differences between the years are typical for this region.
There are normally no outstandingly clear years with very high solar income and no permanently cloudy ones. The solar energy in 2002 was the smallest of the four and near the low end of what might be expected at this latitude, and was 14% smaller than the energy in the highest of the four, 2003.
The year 2002 would also have been cooler and wetter. Would such differences have affected the yield of crops and populations of wild plants? Probably, but not directly and not in proportion to the total energy received. A year’s weather can have great effects on crops and other vegetation: it sometimes causes crop failure, even today; but years differ much more in the way the energy is distributed over time than in the total energy received. The contribution of the annual solar cycle, temperature and wetness to the growth and yield of crops will be the topic of a later article.
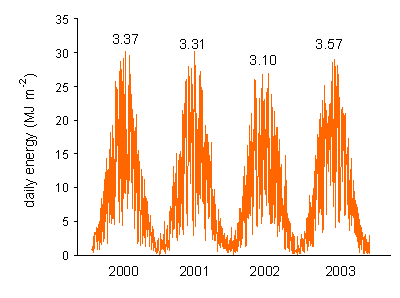
Fig. 6. Solar energy received at the earth’s surface per day at the Hutton Institute (latitude 56 N) over 4 years; numbers above the traces are the annual totals of solar energy in giga-joules per square metre.
Could anything bring about larger variation in the solar income between years than is caused by cloud? Major volcanic eruptions could throw enough dust and ash into the air to cut out a large fraction of the sun’s energy. Eruptions in Iceland (though not the recent one) may have reduced the energy over parts of northern Europe, including Scotland, enough to affect crops, but it’s not clear how much an effect on yield was due to the lower incoming energy or to the fallen dust and ash coating and smothering the crops (see Dawson 2009).
Anything good about the weather?
The solar input to the maritime north Atlantic croplands is highly variable. Though the annual pattern remains roughly similar between years, the variation between days and weeks is large and unpredictable due mainly to the rapidly changing air masses carrying water-laden cloud in from the ocean.
Though unwelcome and unwanted by many, the variable weather may have its good points: the fact that no two years have the same run of weather during crucial stages of the cropping cycle may have forced agriculture and food production to remain diverse and resilient to external forces – and, yes, to be still here, highly productive, after more than 5000 years. Of course we’ll justify this argument elsewhere on the Living Field web site.
Further information and contacts
There are many books on weather and climate, but the best way to get into the topic is to look at data. You can use the links below to get latitude, elevation and azimuth for your favourite place and time.
The National Maritime Museum has web pages on the sun. The Met Office web site contains original information, including pages of historical data. Try the Met Office or BBC Weather pages to get the local weather and the forecast where you are or where you’d like to be. Our own automatic weather station gives output every 15 mins. Sources on archaeoastronomy show people have been measuring and using the solar (and lunar) cycles since the earliest days of settlement.
Azimuth, elevation, latitude
Sun’s elevation and azimuth calculations, daylenth, sunrise and sunset for any place defined by latitude and longitude: US Naval Observatory at the Naval Oceanography Portal.
Latitude and longitude calculations: several web sites available, try LatLong www.latlong.net
Getty Thesaurus of Geographic Names Online (to check the location of a place): www.getty.edu/research/tools/cocabularies/tgn/
The sun
The National Maritime Museum Greenwich has a great web site. Their page on The Sun gives information on (obviously) the sun, sunspot cycles and solar flares.
The Dundee Astronomical Society has images on the sun (solar prominances etc.) in the members’ gallery.
Weather and climate
Dawson A. 2009. So foul and fair a day. A history of Scotland’s weather and climate. Birlinn, Edinburgh UK, 230 pages. ISBN 978 1 84158 567 3.
The UK Met Office hosts a web site showing various data on weather: try www.metoffice.gov.uk/climate and see the page giving Historic Station Data in the UK
BBC Weather www.bbc.co.uk/weather
National Oceanic and Atmospheric Administration, US: Earth System Research Laboratory.
Automatic weather stations at the Institute record weather several times an hour. For further information contact Mark Young, address below.
Archaeoastronomy
Ruggles, Clive. Web site at www.cliveruggles.net on archaeoastronomy (Leicester University UK) with lecture notes and links to books, articles and photographs and discussion of the various arguments.
Brennan, M. 1983. The stars and the stones: ancient art and astronomy in Ireland. Thames and Hudson. (Recent edition as follows) Brennan M. 1994. The stones of time. Inner Traditions International, Rochester, USA. ISBN 978-089281509-8
Links to pages on this site
The effects on plants and people of the annual cycles of solar income and temperature, the latter delayed by about six weeks, are described under The Year, a study of the quarter days and cross quarter days and their relations with agriculture.
Contacts / contributors
Contact and author for this page: Geoff Squire, who first gained an insight into solar income and weather from colleagues in the Environmental Physics group at the University of Nottingham, Sutton Bonington in the 1970s and 1980s.
Automatic weather stations and other environmental instrumentation at the James Hutton Institute: Mark.Young@hutton.ac.uk
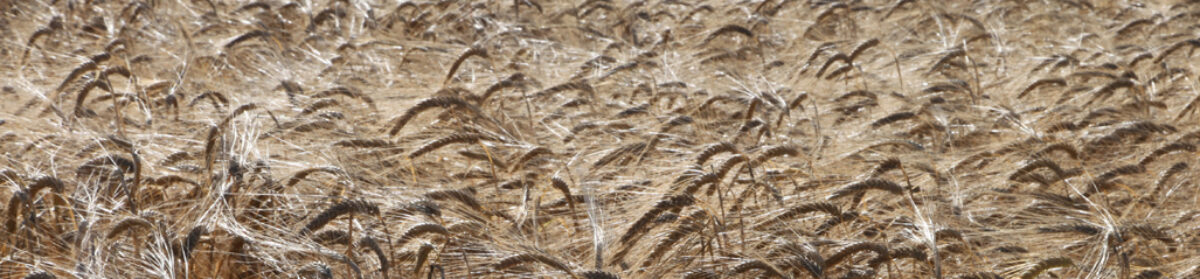
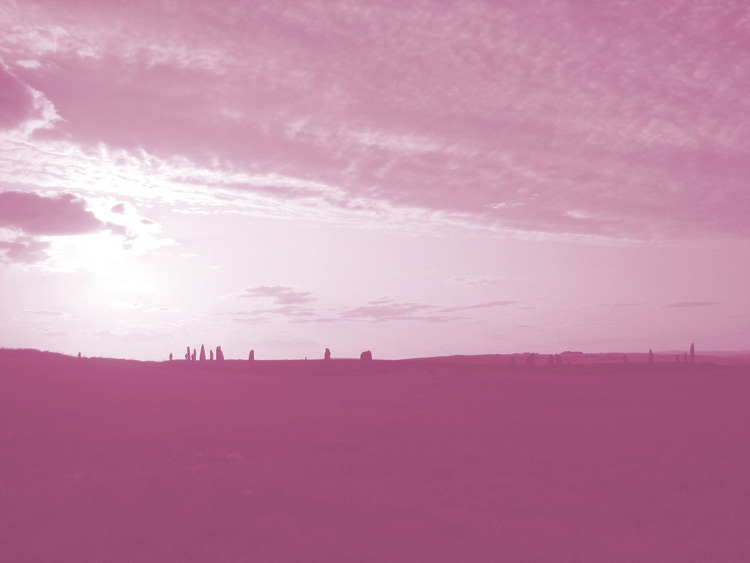
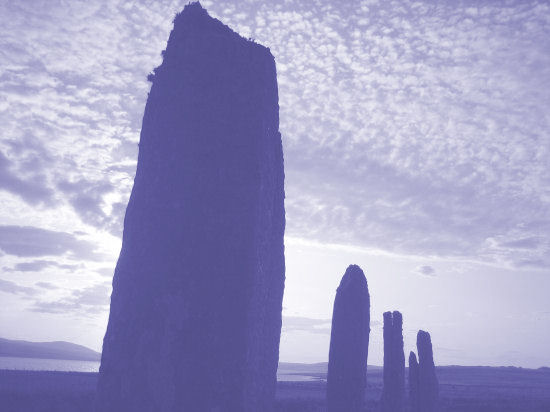
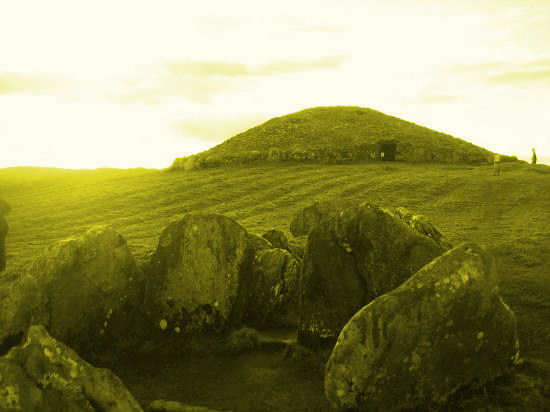
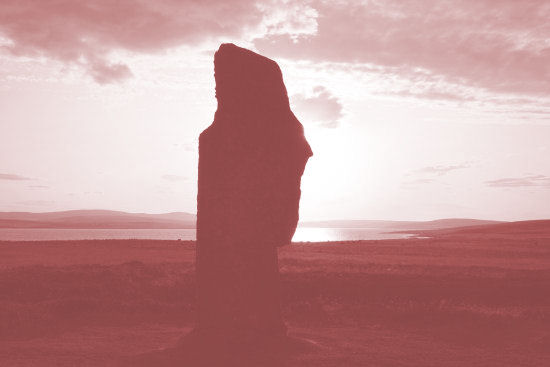
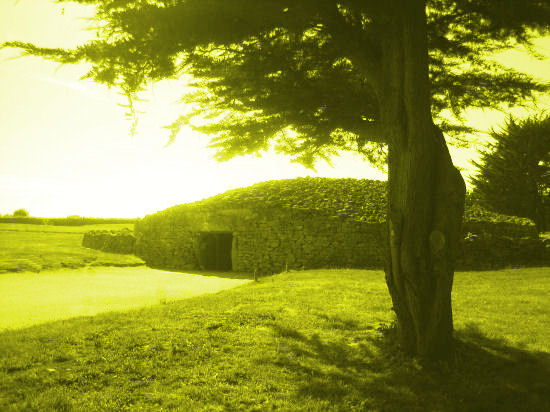
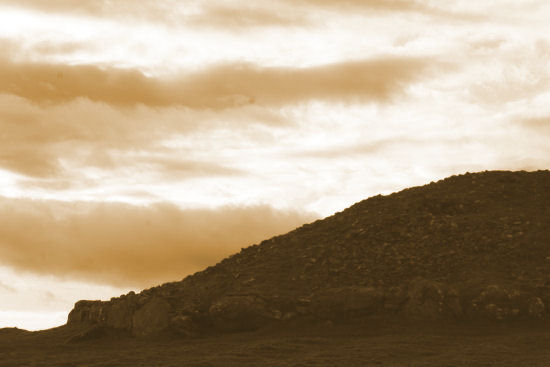
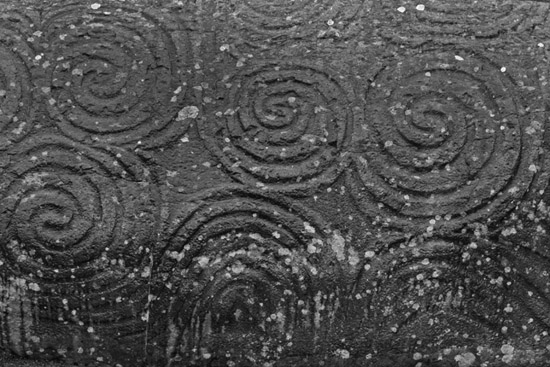
Colour images are of neolithic alignments, stones, henges and mounds, top to bottom: ‘No life without the sun’ – neolithic landscape, Orkney; part of circle of megaliths, Brodgar, Orkney; small circle and mound, Loughcrew, Ireland; single megalith, Brodgar, Orkney; tree and mound, Locmariaquer, Golfe de Morbihan, Brittany; part of mound, Loughcrew, Ireland; symbols on the entrance stone, Newgrange, Ireland.
Original photographs by Kathryn and GR Squire.
[Page went live on the original SCRI Living Field web site 23 September 2010. Transferred to this site and revised 7 May 2015; last update with minor amendments 11 June 2016.]