The energy received from the sun has a strong bearing on the climate of northern latitudes in the Atlantic zone and hence the crops and grass that can grow and yield here [1]. This article gives some background to the solar cycle and shows the changes in daylength, solar elevation and solar income throughout the year. Related articles will cover the variation in solar income over the region, as affected by latitude and cloud cover.
[Return to Climate and crops]
Summary
- The solar energy received at a point on the earth’s surface varies with the earth’s daily cycle and its annual trajectory around the sun.
- These factors determine the period between sunrise and sunset and the height (or elevation) of the sun. As the year progresses from winter to summer solstice at latitude 56 oN (degrees north), the daylight period increases 2.6 times and the maximum solar elevation 5.6 times.
- The sun’s elevation determines the potential ‘intensity’ of solar energy received per unit area of the earth’s surface (e.g. per square metre). Maximum intensity varies with time of day and time of year, but the actual intensity during much of the year is reduced by cloud and haze.
- The average daily solar income is typically 10 – 15 times greater at the summer solstice than at the winter solstice.
- (To be examined in later articles) Such large variation in solar income influences other important climatic factors including temperature and precipitation. The climatic factors together determine which crop and grass species can grow here and their maximum yield.
Light and dark – summer and winter
The sun emits energy continuously, but people living at northern latitudes experience a change in energy and light during each day and between winter and summer. As the earth revolves, each place passes through periods of light and dark. During each revolution, the earth moves a little further along its annual trajectory around the sun. The earth’s tilt and its elliptical (not circular) trajectory round the sun are responsible for seasonal differences in daylength and height of the sun, which together result in very large changes in solar income through the year at northern latitudes [explanatory articles, 2].
The variation in light and dark during the year at latitude 56oN is shown diagrammatically in Fig. 1 [3]. The period between sunrise and sunset is shortest at the winter solstice on 21 December and longest at the summer solstice on 21 June. Periods of light and dark are equal at the two equinoxes. Solstices and equinoxes are sometimes called quarter days in the year’s calendar. Four other points are shown on the figure, sited between each adjacent pair of quarter days. In some traditions, these are referred to as cross-quarter days, abbreviated here to XQ.
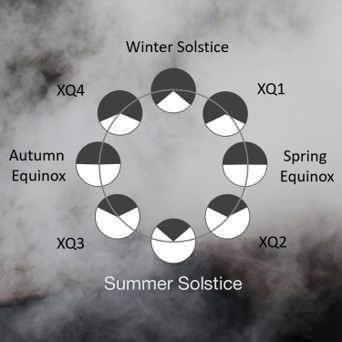
Fig. 1 Diagram of the change in the length of day (white segment of circle) and night (black segment) at the solstices, equinoxes and cross-quarter days (XQ).
The significance of cross-quarter days? They are generally more important markers of the agricultural year than are the solstices and equinoxes. This is because the annual temperature cycle lags behind the annual solar cycle (to be described in a later article), and temperature has a great influence on when crops and grass can grow, and when land can be accessed by machinery. For example, a successful grain harvest depends much more on conditions around XQ3 in early August than on conditions around the summer solstice or autumn equinox.
Solar income – daylength and solar elevation
The change in sunrise and sunset (corresponding to the daylength in Fig. 1) is shown with the change on the sun’s height above ground, its altitude or elevation, in Fig. 2. Here, the horizontal axis is not time of day but the azimuth, the number of degrees in a clockwise circle from north at which the sun rises or sets (so east is 90o, south 180o and west 270o). At latitude 56oN, the sun at the summer solstice rises at 04:21 hours at azimuth 42o and sets at 22:06 hours at 318o. At the winter solstice, it rises at 08:44 hours at azimuth 134o and sets at 15:35 at 220o (data for the year 2020).
The elevation of the sun – its height above the horizon – rises and falls within the year in the same direction as change in daylength. Its elevation is just above 10o at the winter solstice, rising to 57o degrees at the summer solstice. Throughout the range of latitude considered here [1], the sun always rises above the horizon for part of the day. At 56 oN, the daylight period increases 2.6 times and the maximum solar elevation 5.6 times from winter to summer solstice. On any day, sunrise, sunset, and solar elevation vary with latitude through the region [3].
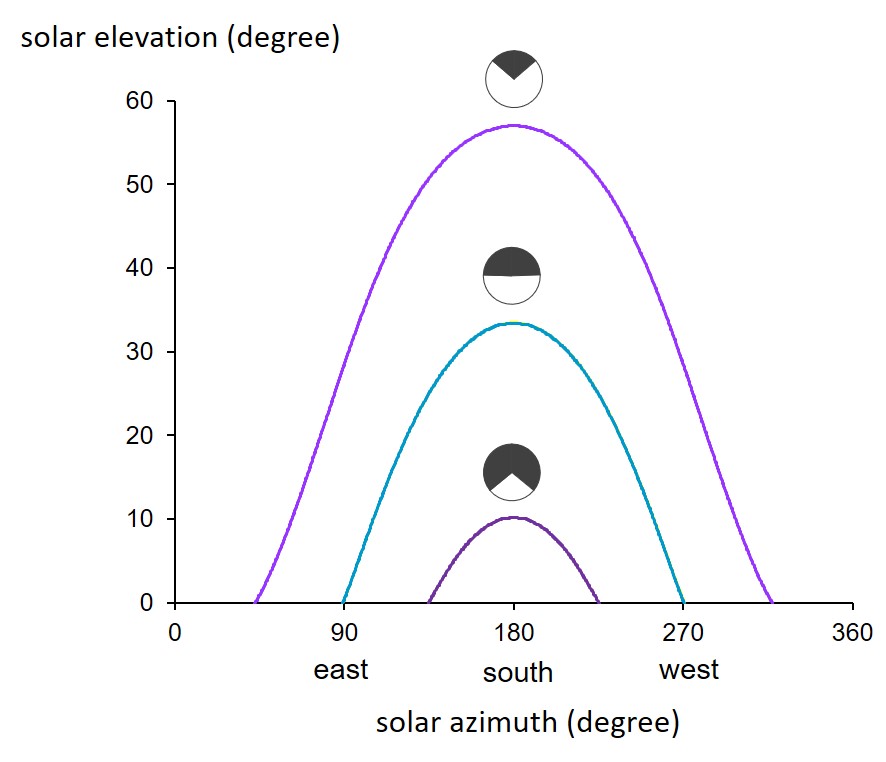
Fig. 2 Change in solar elevation during a day in relation to the solar azimuth (degrees clockwise from north) at the winter solstice (lower curve), the equinox (middle) and the summer solstice (upper) at latitude 56 oN, the white-black roundels taken from Fig. 1.
The sun’s energy consists of short-wave radiation [4], which is distinguished from the long-wave radiation emitted by all objects (land, water, building, animals). Most met stations now use a solarimeter to measure the sun’s energy or irradiance [5], expressed in units of watt (W) per square metre (m2), where a watt is a joule per second [6]. The example in Fig. 3 shows the course of irradiance between sunrise and sunset on a clear day in late May. It is similar in shape to the course of solar elevation in Fig. 3. The high point at solar noon under a clear sky is around 700 W/m2 in the example, but this varies with latitude and time in the solar year, and can also can be reduced by cloud and haze at any time and place.
If solar irradiance is accumulated over the many seconds in a day, the total energy is expressed in joules (per square metre) but because the numbers are so large, they are given in megajoules (unit MJ) where a MJ is a million J. The example in Fig. 3 accumulated to around 23 MJ/m2. The megajoule value of a day is useful when comparing times of year and different years, and also different places on the planet.
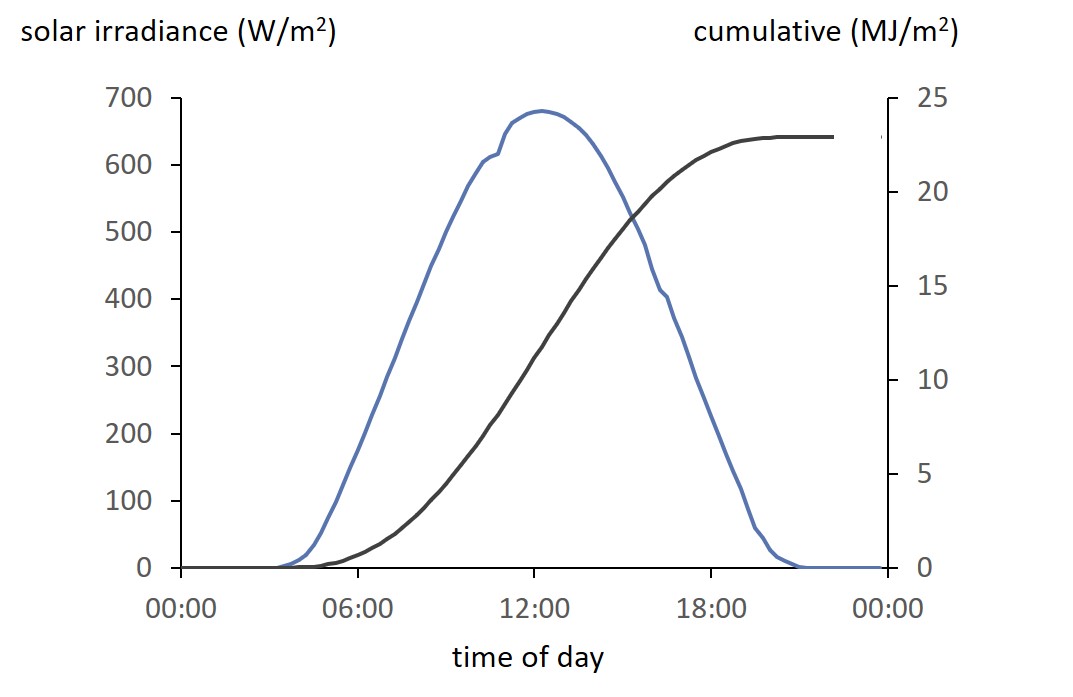
Fig. 3 Solar income on a cloudless day in May at latitude 56 oN: instantaneous value recorded by a Kipp solarimeter (blue line) and the total accumulated from sunrise to sunset (grey line).
Yearly variation in solar income
On clear days in summer, the solar income may rise to near 30 MJ/m2 but will be little more than 10% of this on a clear day near the winter solstice. Very dense cloud in summer can also reduce solar income to 10-20%. Because cloud cover is highly variable, the actual annual course of daily solar income is unique to each year. However, the underlying pattern is still discernible and usually follows a sine curve, lowest near the winter and highest near the summer solstice.
In the particular example of a year-cycle in Fig. 4, the fitted value at the high point (17.8 MJ/m2) is 11.9 times greater than that at the previous low point (1.5 MJ/m2). As described above, the difference is due to a combination of the longer daylight period and the greater elevation of the sun, together with variable influence of cloud cover. In most years, the solar income at the summer solstice is between 10 and 15 times greater than at the winter solstice.
The shape and magnitude of the annual cycle of solar radiation combine to give one of the strongest determinants of climate and agriculture in the region. Temperature is the other strong factor, itself partly influenced by the solar cycle, but also by the region’s ‘oceanicity’, which results in the dampening of the extremes in Fig. 4 due to proximity to the sea.
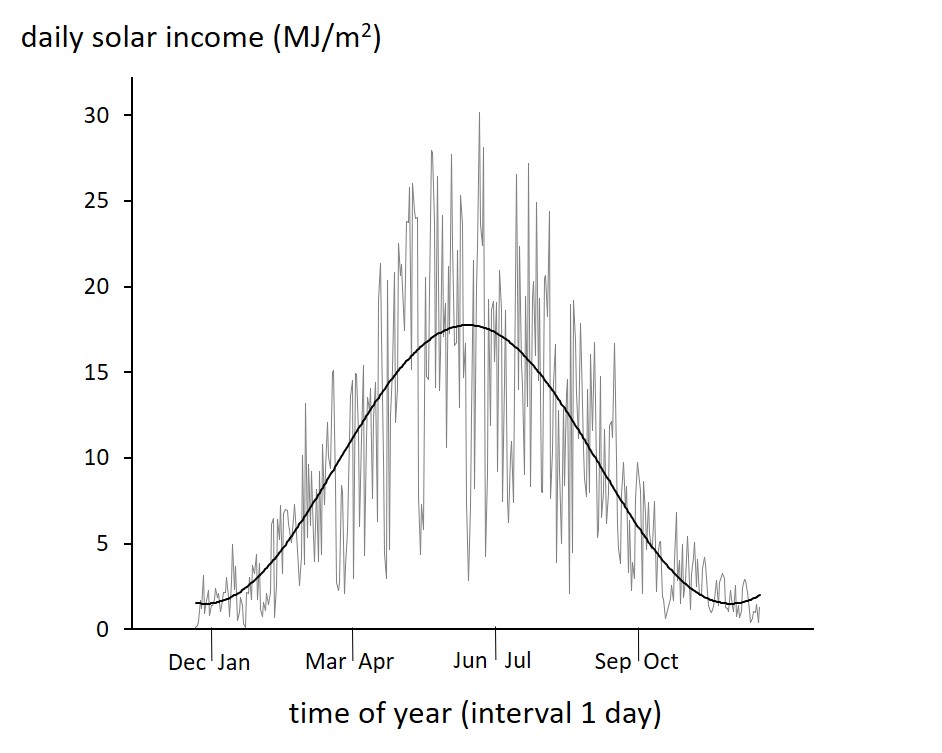
Fig. 4 Day by day variation in solar income through a year at latitude 56 oN, longitude 3 oE, with fitted sine wave.
Consequences
The basic shape of the annual cycle in Fig. 4 and the corresponding curve for temperature (to be described in a later article) define the types of agriculture that are possible and economically viable here, namely –
- the plant species that can grow here profitably, such as temperate varieties of three main corn crops, three pulse species, ‘roots’ such as potato and swede, many vegetables and fruits, and numerous grass and forage legumes … but excluding most species of tropical origin;
- the time of year when ground can be cultivated, seed sown, grass cut or grazed;
- the rate at which crops and grass grow and the maximum yield they can attain – the long cool summers, but still relatively high solar income, at these latitudes support some of the highest yields in the UK;
- variation with distance south-north in the most suitable crops and grass and the localities that give the maximum productivity.
Further articles will cover the above and attempt to explain how future variation in weather and climate might affect crop species, field operations and productivity, and whether the region will likely suffer more from nutritional or economic insecurity due to climatic change.
For further reference, a comprehensive background to solar radiation and its variation across Europe is given in the European Solar Radiation Atlas [7].
Sources / References
[1] The geographical region examined in this series of articles on climate and food sustainability lies within the Atlantic climatic zone of western Europe. The area covers the cropland and grassland that has been the focus of the Living Field project over the past two decades. It ranges between latitudes 54 and 61oN. The most productive cropland lies between 55 and 58oN in lowland Scotland. Solar radiation records shown in this article are from a met station at the James Hutton Institute, Dundee near 56oN.
[2] For explanation of the earth’s tilt and solar trajectory, try: Articles about Sun at timeanddate.com; a BBC Weather page; the explainingscience blog. For a thorough and authoritative account: Szokolay S.V. 1996 (rev 2007). Solar geometry. Passive and Low Energy Architecture International (PLEA) and Department of Architecture, University of Queensland.
[3] The examples in Fig. 1 to 4 are modified from articles at The Year on this site. A recent article gives more background to sunrise, sunset, daylength and twilight – Through the solstice.
[4] The sun’s short-wave radiation includes wavelengths that have various effects on soil, plants and animals. For example, a large part of the range – about half of it in terms of energy – can be used by plants in photosynthesis to take in carbon dioxide from the air. The standard reference instrument at most met sites is a Kipp and Zonen solarimeter, which measures total solar irradiance, the metric used in this series of articles.
[5] For many years in the past, and still to some extent today, meteorological sites operated a Campbell-Stokes sunshine recorder which measures the hours and minutes of bright sunlight. The measure is of little direct use in analysing and modelling growth of crops and grass. Yet to analyse historical records consistently, solar radiation has to be estimated from sunshine hours, or in some cases air temperature. The conversions are not direct and subject to uncertainty, as explained in a Hutton Institute paper: Rivington M. et al. (2005) Evaluation of three model estimations of solar radiation at 24 UK stations. Agriculture and Forest Meteorology 132, 228-243. doi.org/10.1016/j.agrformet.2005.07.013
[6] Note on units: in Fig. 3, ‘watt per square metre’ is abbreviated to W/m2 – the slanting line (oblique line or solidus) indicating ‘per’ and the superscript ‘2’ indicating ‘squared’ but most scientific authorities prefer to omit the solidus and insert a minus sign before the superscript ‘2’, i.e. W m-2.
[7] European Solar Radiation Atlas. Vol 1 Horizontal Surfaces: available for download via the Publications Office of the European Union – gives maps of solar income for Europe. Background to the project is given in an article: Page, Albuisson and Wald (2001)The European Solar Radiation Atlas: a valuable digital tool. Solar Energy 71 (1), 81-83; usually available online through various sources, try searching by authors and ‘solar energy’.
Author/contact: geoff.squire@hutton.ac.uk or geoff.squire@outlook.com