There are parts of the world where every day is clear and bright for months on end. Not so on the western fringes of Europe, where cloudy days are commoner than clear days. The solar income reaching the earth’s surface is diminished by this cloud, but all is not bad for agriculture. Cloud means rain and the absence of drought in most years, while the specific combination of solar income and temperature in eastern Scotland supports among the highest agricultural yields in the UK.
[Return to Climate and Crops]
Summary
- Cloud cover is a defining feature of the region, reducing the amount of solar radiation reaching the earth’s surface.
- The total solar income in a year varies typically between 3.1 and 3.5 GJ m-2. That’s about half the value received in hot tropical climates.
- The pattern of cloud cover during the year is much more variable than the total radiation received and, with the associated rainfall, is the climatic factor that commonly determines a ‘good’ or a ‘bad’ year for agriculture.
- Solar income decreases from south to north in the UK but the optimum climate for supporting crops and grass lies in the upper-centre of the range, which includes arable east Scotland.
Daily variation
Cloud is common on the Atlantic fringe of Europe. This statement of the obvious – to those who live and work here – is needed because many parts of the world have several weeks or months every year without cloud. In some such places, it is also too hot and dry for plants to grow. The high solar is no use to them at this time. Cloud in contrast means a chance of rain, and plants like ‘the wet’ if there is not too much of it and can grow here most of the year.
As an example, run of solar irradiance through five days is shown in Fig. 1 [2]. The cloud-free day – the fourth one along – shows an almost symmetrical rise and fall in irradiance. The cumulative total for the day is 14.1 MJ m-2 [1] The other days all have cloud, but each day shows a different pattern.
On two days (first and fifth) the irradiance peaks above the highest on the clear day – and this is due to a combination of the direct solar beam and some forward diffraction just as cloud moves to obscure the sun. Mostly, the cloud causes a reduction in irradiance. The cloudiest day here, the first, has a cumulative total of 65% of that of the clear day. On days or unending dense cloud, the total can fall to around 10% of the cloud-free total for the time of year [1].
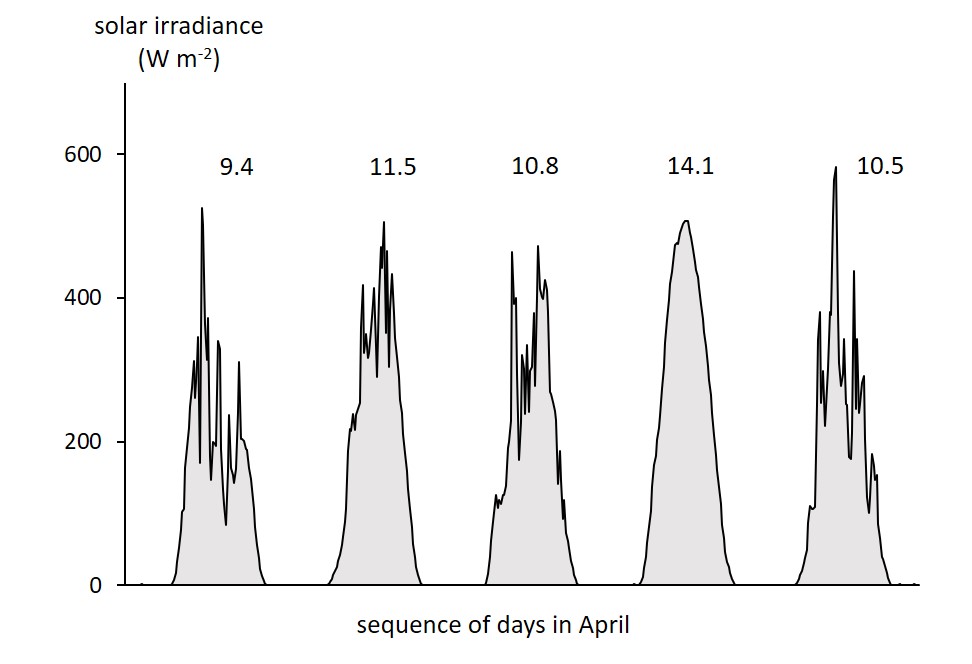
Fig. 1 Solar irradiance averaged over 15 minute periods during 5 days in April, the daily total in MJ m-2 given above each day [1].
Variation between years
The cumulative total solar radiation for each day is shown in Fig. 2 over a run of years. The sequence of days shown for April in Fig. 1 occurs about half-way up the rising part of the annual solar cycle. Total solar per day increases until late June then begins to fall again.
The years in the upper group are not chosen for any particular feature except to show that years differ more in the pattern of daily radiation than in the annual total. The total varies typically between 3.1 and 3.5 GJ m-2 (giga-joules per square metre of earth’s surface) but it’s the precise pattern of cloud in any year that brings benefits or problems for agriculture (as described in later articles) –
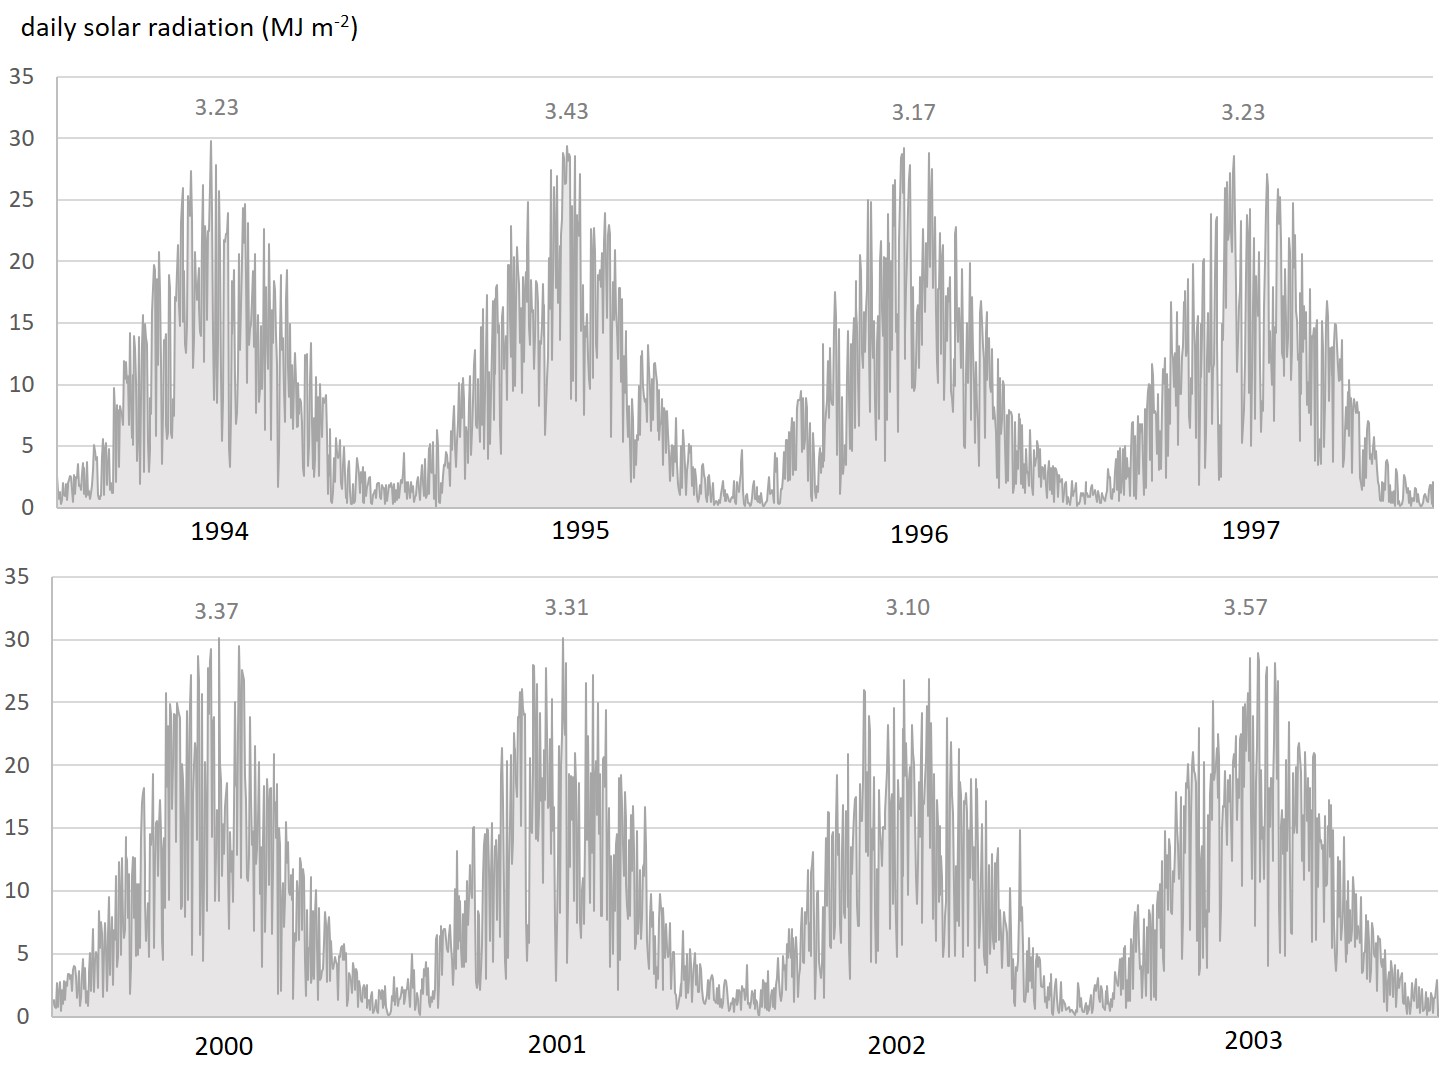
Fig. 2 The total solar radiation received each day over two periods of four years at latitude 56oN, the year’s total in GJ m-2 given above each year [1].
The sequence of four years in the lower part of Fig. 2 shows slightly greater year to year variation than in the upper part. In 2002, the cumulative total is at the low end of the range while in 2003 it is at the high end. In years such as 2002, yields of the main crops are reduced, but it is the associated rainfall rather than the low solar alone that is the cause (see below).
Log-term variation between regions of the UK
Long term records of solar income, measured as global irradiance, go back only a few decades [3]. Data from early last century are available only for sunshine hours as recorded by a Campbell-Stokes instrument [4, 5]. The Campbell-Stokes does not register the diffuse radiation received when cloud covers the sun, and so a site with many sunny days will appear to have a higher solar income than one where diffuse radiation predominates.
The Met Office has calculated long-term spatial averages of sunshine hours for UK regions and made them available online [4]. Examples for three regions are given in Fig. 3: sunny East Anglia in the south-east of England, Scotland east (where lies most of Scotland’s prime agricultural land) and Scotland north. A map showing these and other regions is also available at the Met Office web site.
Sunshine hours are highly variable between years but show major a decrease from south to north. As explained above, total (direct and diffuse) solar differs less than sunshine hours between the regions but there is still a marked decrease of total solar northwards. Records also show what appears to be a gradual rise since about 1980 [5].

Fig. 3 Number of sunshine-hours recorded each year in three regions, the average of each shown by the horizontal line, from the Met Office’s UK and Regional Series [4].
Solar income and agricultural production
Plants use solar radiation to grow, so it might appear that the more solar radiation available, the more growth and yield. If so, production would decrease northwards in the UK and very cloudy years would yield less than years of just average cloud.
In general, high solar income helps to boost yields, but the links between solar income and agricultural production are not direct and are usually modified by other factors, especially temperature and precipitation.
Cloudy years
Let’s look at year by year variation in solar income and cloud cover. Very cloudy years tend to be associated with a small depression of yield. In the past two decades, two years in particular – 2002 and 2012 – were both very cloudy and wet. The average cereal yield over the 20 years, 2000-2019, was 6.49 t ha-1 (tonnes per hectare). The yield in 2002 was 88% of the average and that in 2012, 85% [6].
These reductions were not insignificant, but compared to yield-variation across the globe, they are fairly small. Moreover, it was rainfall associated with the cloud that caused most of the problem. Yield was suppressed directly by waterlogged or flooded soil and indirectly because farm machinery had difficulty in managing and harvesting the crops. (More on this in a later article.)
These small depressions of yield should also be viewed in the context of other change. The greatest annual reductions in total grain output in Scotland in the past 3-4 decades were not due to the weather, but to the introduction of ‘set aside’ in the 1990s, which encouraged farming to take land out of production.
The south-north decline
The south-north decline in sunshine and solar radiation presents a more intriguing story. Agricultural yields do not decline south to north in the same way as solar income: rather, they increase with distance north but only up to a point (an optimum latitude) after which they fall again. Yields per unit area in east Scotland for example are among the highest in the UK – the area is close to the optimum. The reason behind this perhaps surprising trend is due to the interplay between temperature and solar income and is commonly called the ‘long-cool-summer effect’.
The climatic basis of the long-cool-summer effect, and the way types of crops and grass are affected differently by it, is central to understanding climate and food security in the UK and will be examined later in this series.
Sources / references
[1] Solar irradiance data in Fig 1 and Fig. 2 were measured by a Kipp and Zonen solarimeter located at the James Hutton Institute met site near Dundee at 56 N 3 E (thanks to Mark Young). Further information on daily and seasonal accumulation of solar radiation is given in the first article in this series – Solar income.
[2] The sun’s energy reaching the earth is measured by standard solarimeters that record global or total solar irradiance. The global (total) consists of direct irradiance received at the earth’s surface when the sun is not obscured and diffuse irradiance that passes through cloud or dense haze.
[3] The Met Office and Natural Environment Research Council have tabulated, and made available online, solar irradiance measured hourly at a range of UK sites that have recorded irradiance using a standard solarimeter (as distinct from a bright-sunshine recorder). Data can be accessed at CEDA Archive MIDAS Open: UK hourly solar radiation data. (Visitors will need to register.) The period of measurement at most sites is several decades, not long enough usually to establish a trend.
[4] Data of the type used in Fig. 3 above are available from the Met Office page with the title UK and Regional Series: https://www.metoffice.gov.uk/research/climate/maps-and-data/uk-and-regional-series. Probably best start by choosing Year-order, then the Region and Parameter of interest, and press Download. A page of data appears: one option is to outline and copy the data you want and then paste it directly into a spreadsheet such as Excel. Then using ‘Data’ and ‘Text to Columns’, convert the file to a standard spreadsheet format which can be re-arranged and analysed.
[5] Related data, including 30-year averages and maps of sunshine and other weather variables, are available through a separate Met Office page titled Climate Averages https://www.metoffice.gov.uk/research/climate/maps-and-data/uk-climate-averages. Enlarge the map and click on the target weather station to to see various data and maps. More background on recent trends in weather variables is at the Carbon Brief web site in the article Met Office: A review of the UK’s Climate in 2020.
[6] Yield of the main grain crops in Scotland is summarised annually by Scottish Government. For data of the last two decades, see Cereal and Oilseed Rape harvest: 2019 then click Supporting Files on the right of the page, download Tables and Charts and the yields for 2000-2019 are at Table 2.
Contact: geoff.squire@hutton.ac.uk and geoff.squire@outlook.com
[Last update – 26 February 2021 – minor edits]