
Wheat – a major staple carbohydrate. Global production and area by country. Variation in yield per unit area and its causes. Production in the UK and Scotland. Food security in the face of climate and conflict.
Wheat Triticum aestivum is an ancient crop, grown in the UK for thousands of years. It is now the main cereal both eaten and grown here. Questions of food security have arisen early in 2022 as a result of conflict in Europe: where does our wheat come from, is home-grown wheat enough, will imports be cut, will the price of food rise ?
Wheat and other cereals
Three major cereal crops – wheat, rice and maize – provide carbohydrate and nutrients to most of the world’s people. Wheat tends to dominate in temperate lands, particularly across Asia and Europe. It is the most widespread of cereals and provides the staple carbohydrate to the most people in the world.
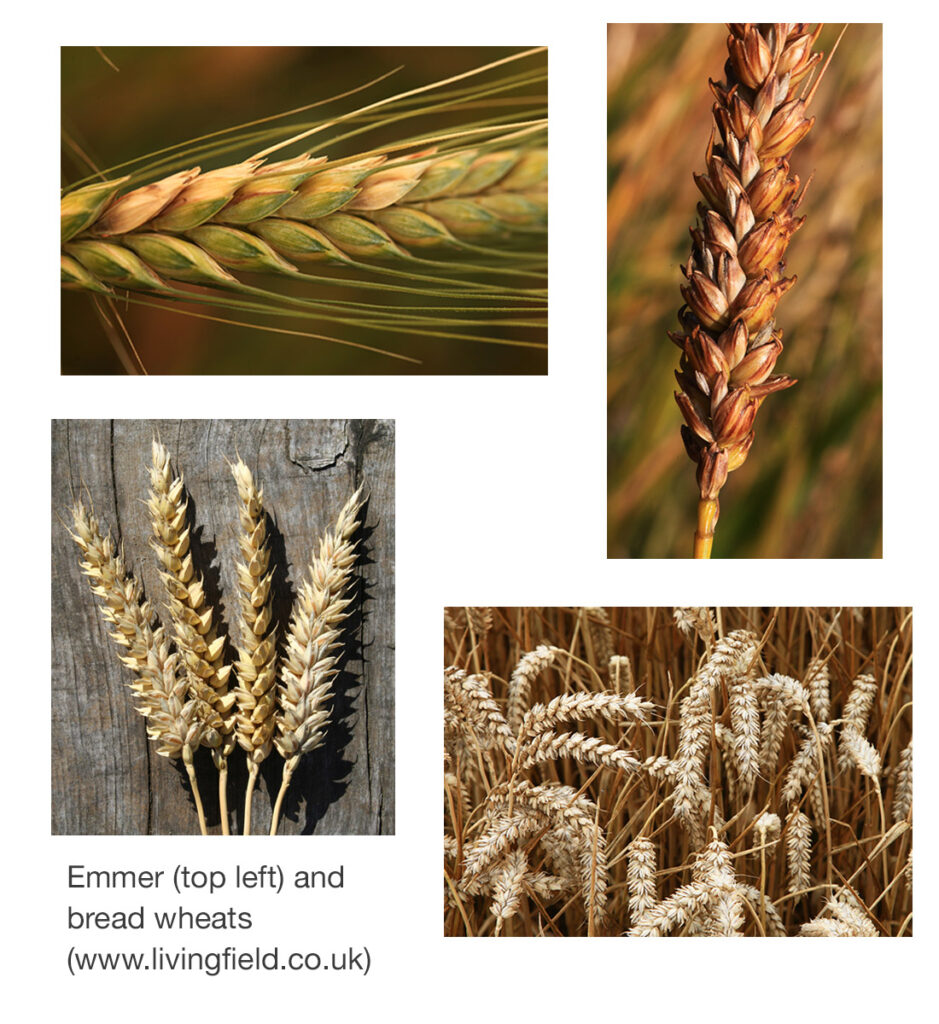
Of the many other wheat species, durum Triticum durum, used to make pasta, is the only one grown over large areas. Emmer Triticum dicoccum and spelt Triticum spelta were among the earliest domesticated wheats, and though once grown widely, are now minor crops.
Global wheat production
The Food and Agriculture Organisation [1] records annual production of wheat and other crops. Records compiled are usually supplied by countries based on government surveys of area and yield, so are subject to error in sampling and recording. However, the values shown in Fig. 1 should be a reflection of actual production.
The top four producers are China, India, Russia and USA. Four countries in western Europe produce more than the USA and a little more than Russia, but less than India or China.
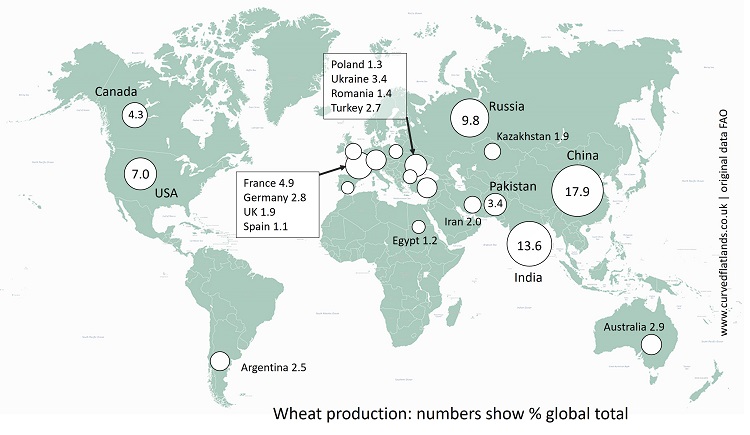
Fig. 1 Countries growing most of the world’s wheat: circles and numbers show percentage (%) of the total in 2018. Original data: FAOSTAT.
Area, production and yield per unit area
The values of percentage global production in Fig. 1 can be compared in terms of area sown with the crop, total grain production from that area and hence grain yield per unit area. The symbols on Fig. 2 represent grain yield per unit area. China, India and Russia have by far the largest area, but they differ in what is produced per unit area: for example, China at nearly 6 t/ha (metric tonnes of grain per hectare) is around twice that of Russia.
Apart from the above three and USA, Canada, Australia and Kazakhstan, wheat producers have areas of less 9 million hectares and most countries have less then 3 million.
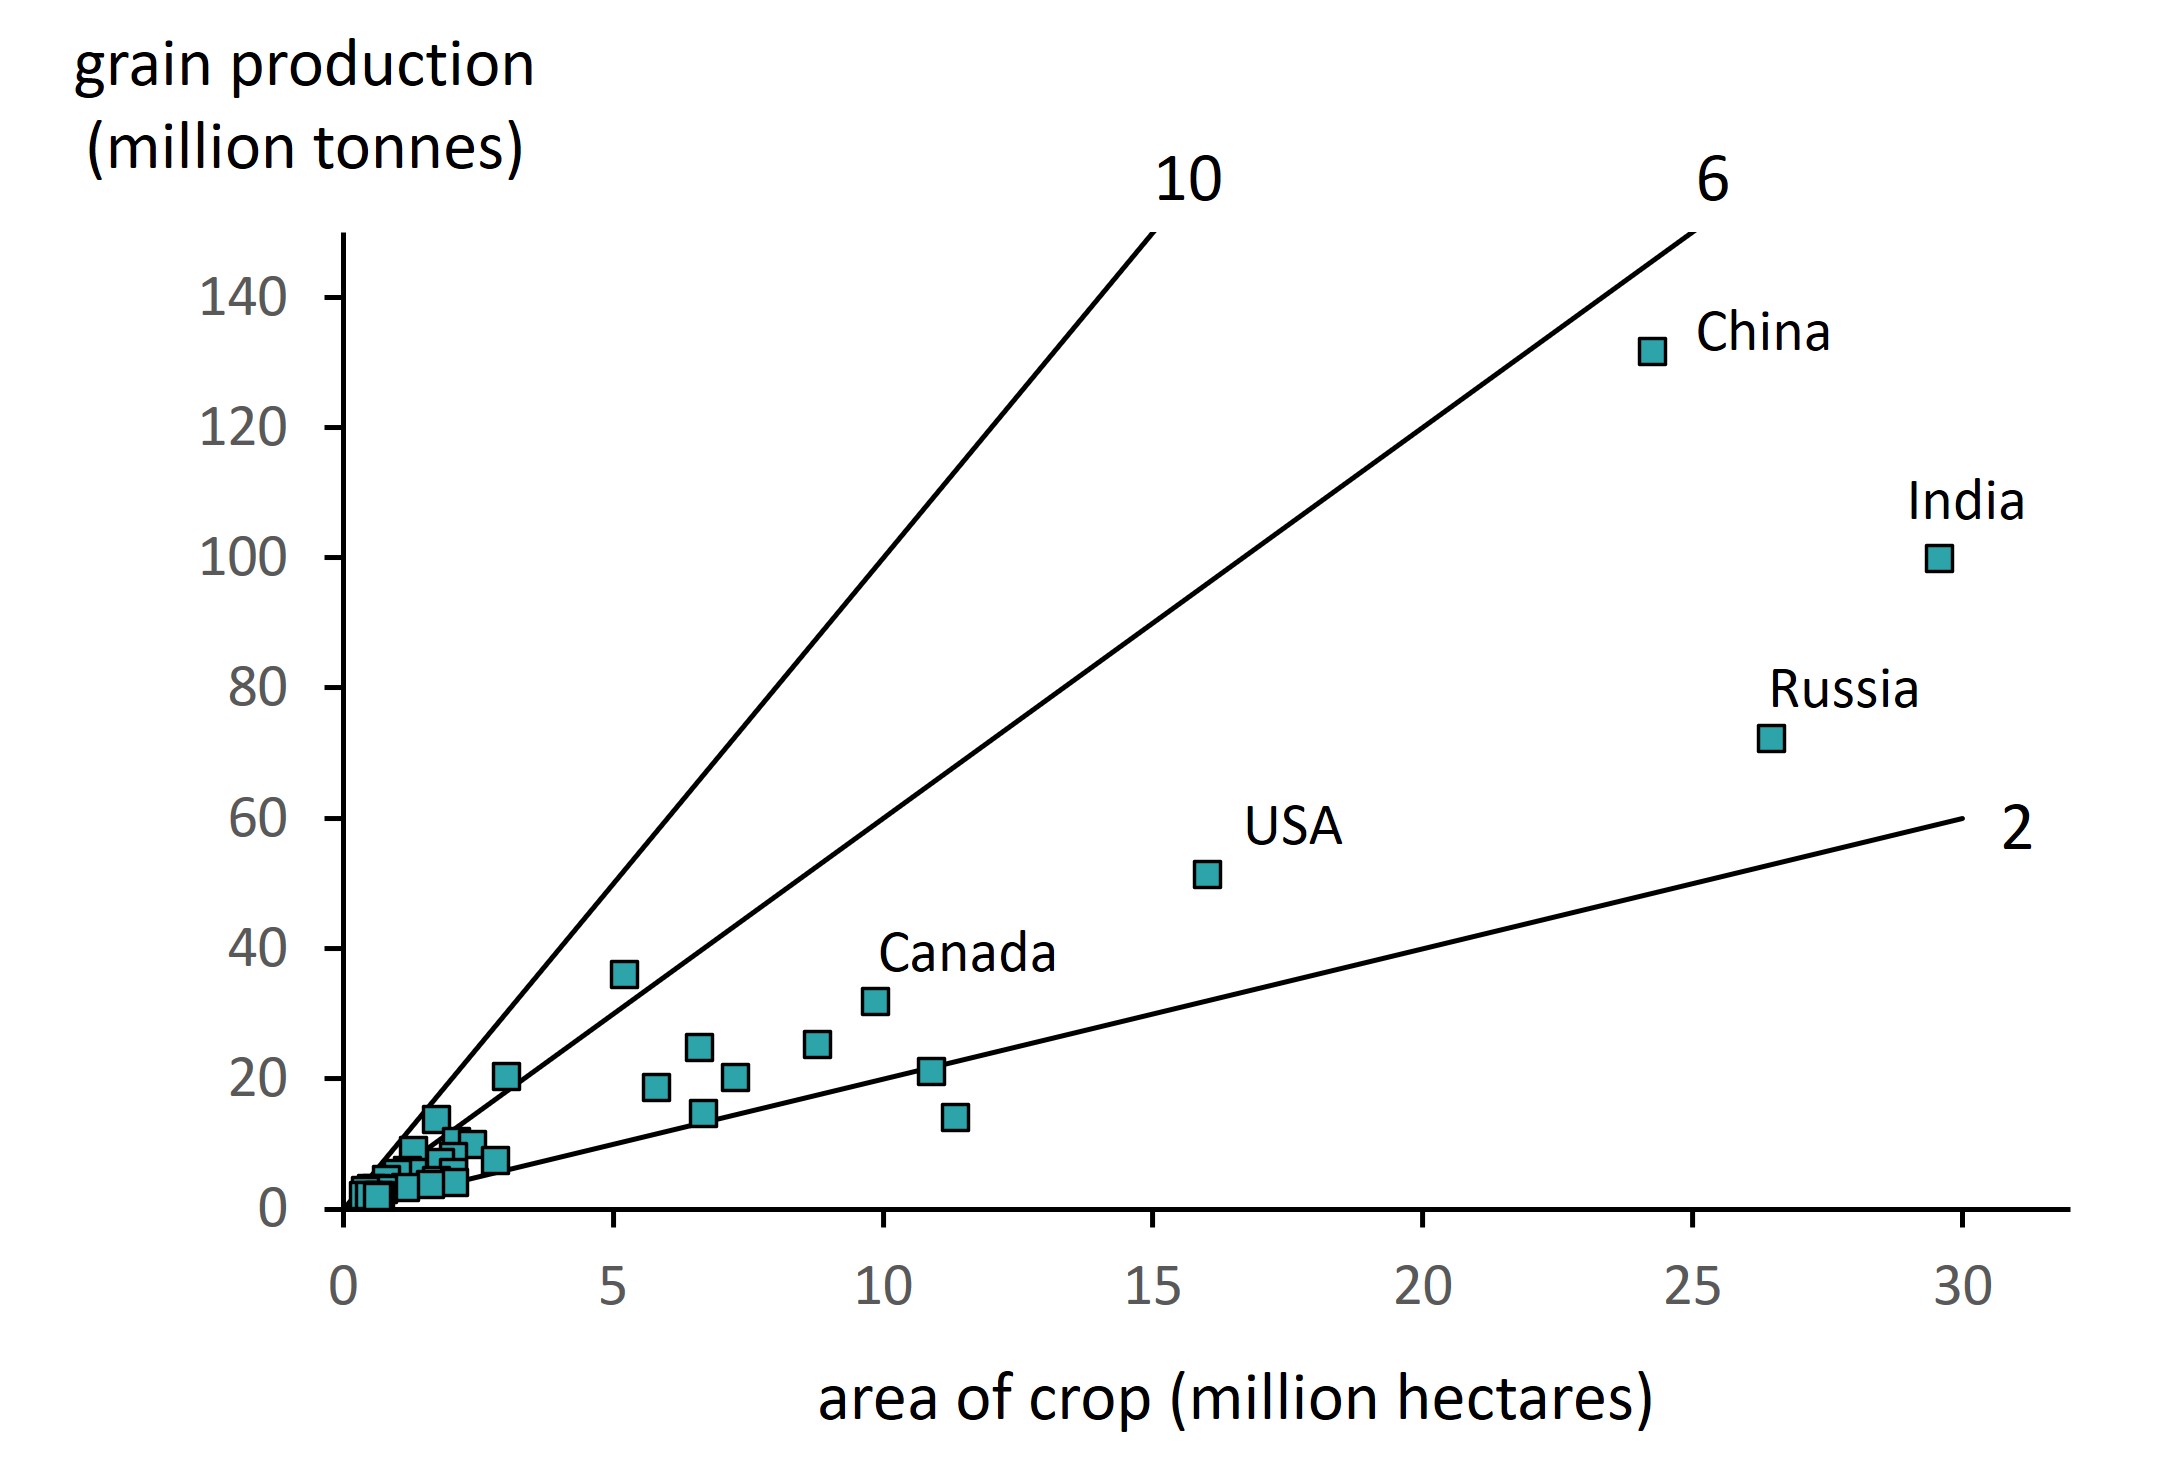
Fig. 2 Total wheat grain production (vertical) and area of land sown with wheat (horizontal) for countries shown on Fig. 1, data for 2018. Lines are for values of yield per unit area of 2, 6 and 10 t/ha (metric tonnes per hectare). Original country data: FAOSTAT.
The lower end of the range of sown area in shown in Fig. 3. Most of the intermediate producers achieve between 2 and 6 t/ha. Those with yields above 6 t/ha are mainly in western Europe: France, Germany and the UK.

Fig. 3 Data in Fig. 2 limited to lower values of production and area.
Why does yield per unit area vary so much?
There are many reasons for the range of yield per unit area in Fig. 2 and 3. Chief among them are:
- Climate: places with the highest yield per unit area are located in western Europe, in a largely maritime climate with ‘mild’ winters, where long season varieties can be sown in autumn to grow for almost 11 months of the year; colder winters, or less rainfall, in other regions restricts length of the season and hence the capacity to absorb solar income.
- Soil and topography: limitations may be local or regional due to shallow or infertile soil, which will hold insufficient plant resource in the rooting zone, while steeper slopes make it difficult for modern machinery to operate.
- Agronomy and inputs: places supporting high yield per unit area also tend to apply more fertiliser and pesticide; among the main fertilisers, nitrogen in particular has the dual functions of generating leaf and root to encourage rapid growth and forming a major constituent of the grain.
- Intended use: wheat is used to make different types of food, including bread, biscuits, flatbread and noodles, and is also grown to feed livestock and to make alcohol. These intended uses rely on different varieties which may have inherently different growth characteristics and need different inputs of nitrogen to yield well.
Trends and variation in climate and weather interact with all the above, leading to bounty or shortage depending on the particular circumstances.
Production vs exports
Countries differ not just in how much wheat they produce (Fig. 1-3), but in the amounts they export and import. While some countries have more than they need and export the surplus, others, even if they grow wheat, do not grow enough or enough of the right sort of wheat to sustain their people, and so import it from other countries. Imbalances between home production, import and export have the power to create tensions in global supply chains that are often felt though increase in price and decrease in availability.
The present conflict in eastern Europe is an example that will have many ramifications. Russia is third in terms of production but top for exports. Ukraine is also higher in the ranking for exports than for production. The tension will heighten as the coming year’s harvest from these countries is likely to be reduced and the supply chains restricted.
Who will be affected? Few countries will avoid price increases and shortages of some global wheat products, but those most severely affected will be countries that rely heavily on exports of wheat from Russia and Ukraine [2, 3]. Most of these countries are in the Middle East and North Africa (MENA) and some of them are already seeing food shortages, hunger and famine.
But what about the UK?
Wheat production and supplies in the UK
Many types of cereal have been tried in Britain in the 5000-6000 years since the first farmers arrived. The main three that have remained today are bread wheat, barley and oats. Wheat is the major cereal in most central and southern areas, while barley covers more land area and produces more grain than wheat in the north (Fig. 4). Very little of the barley goes directly to human food, so wheat is the main cereal both grown and eaten in the UK.
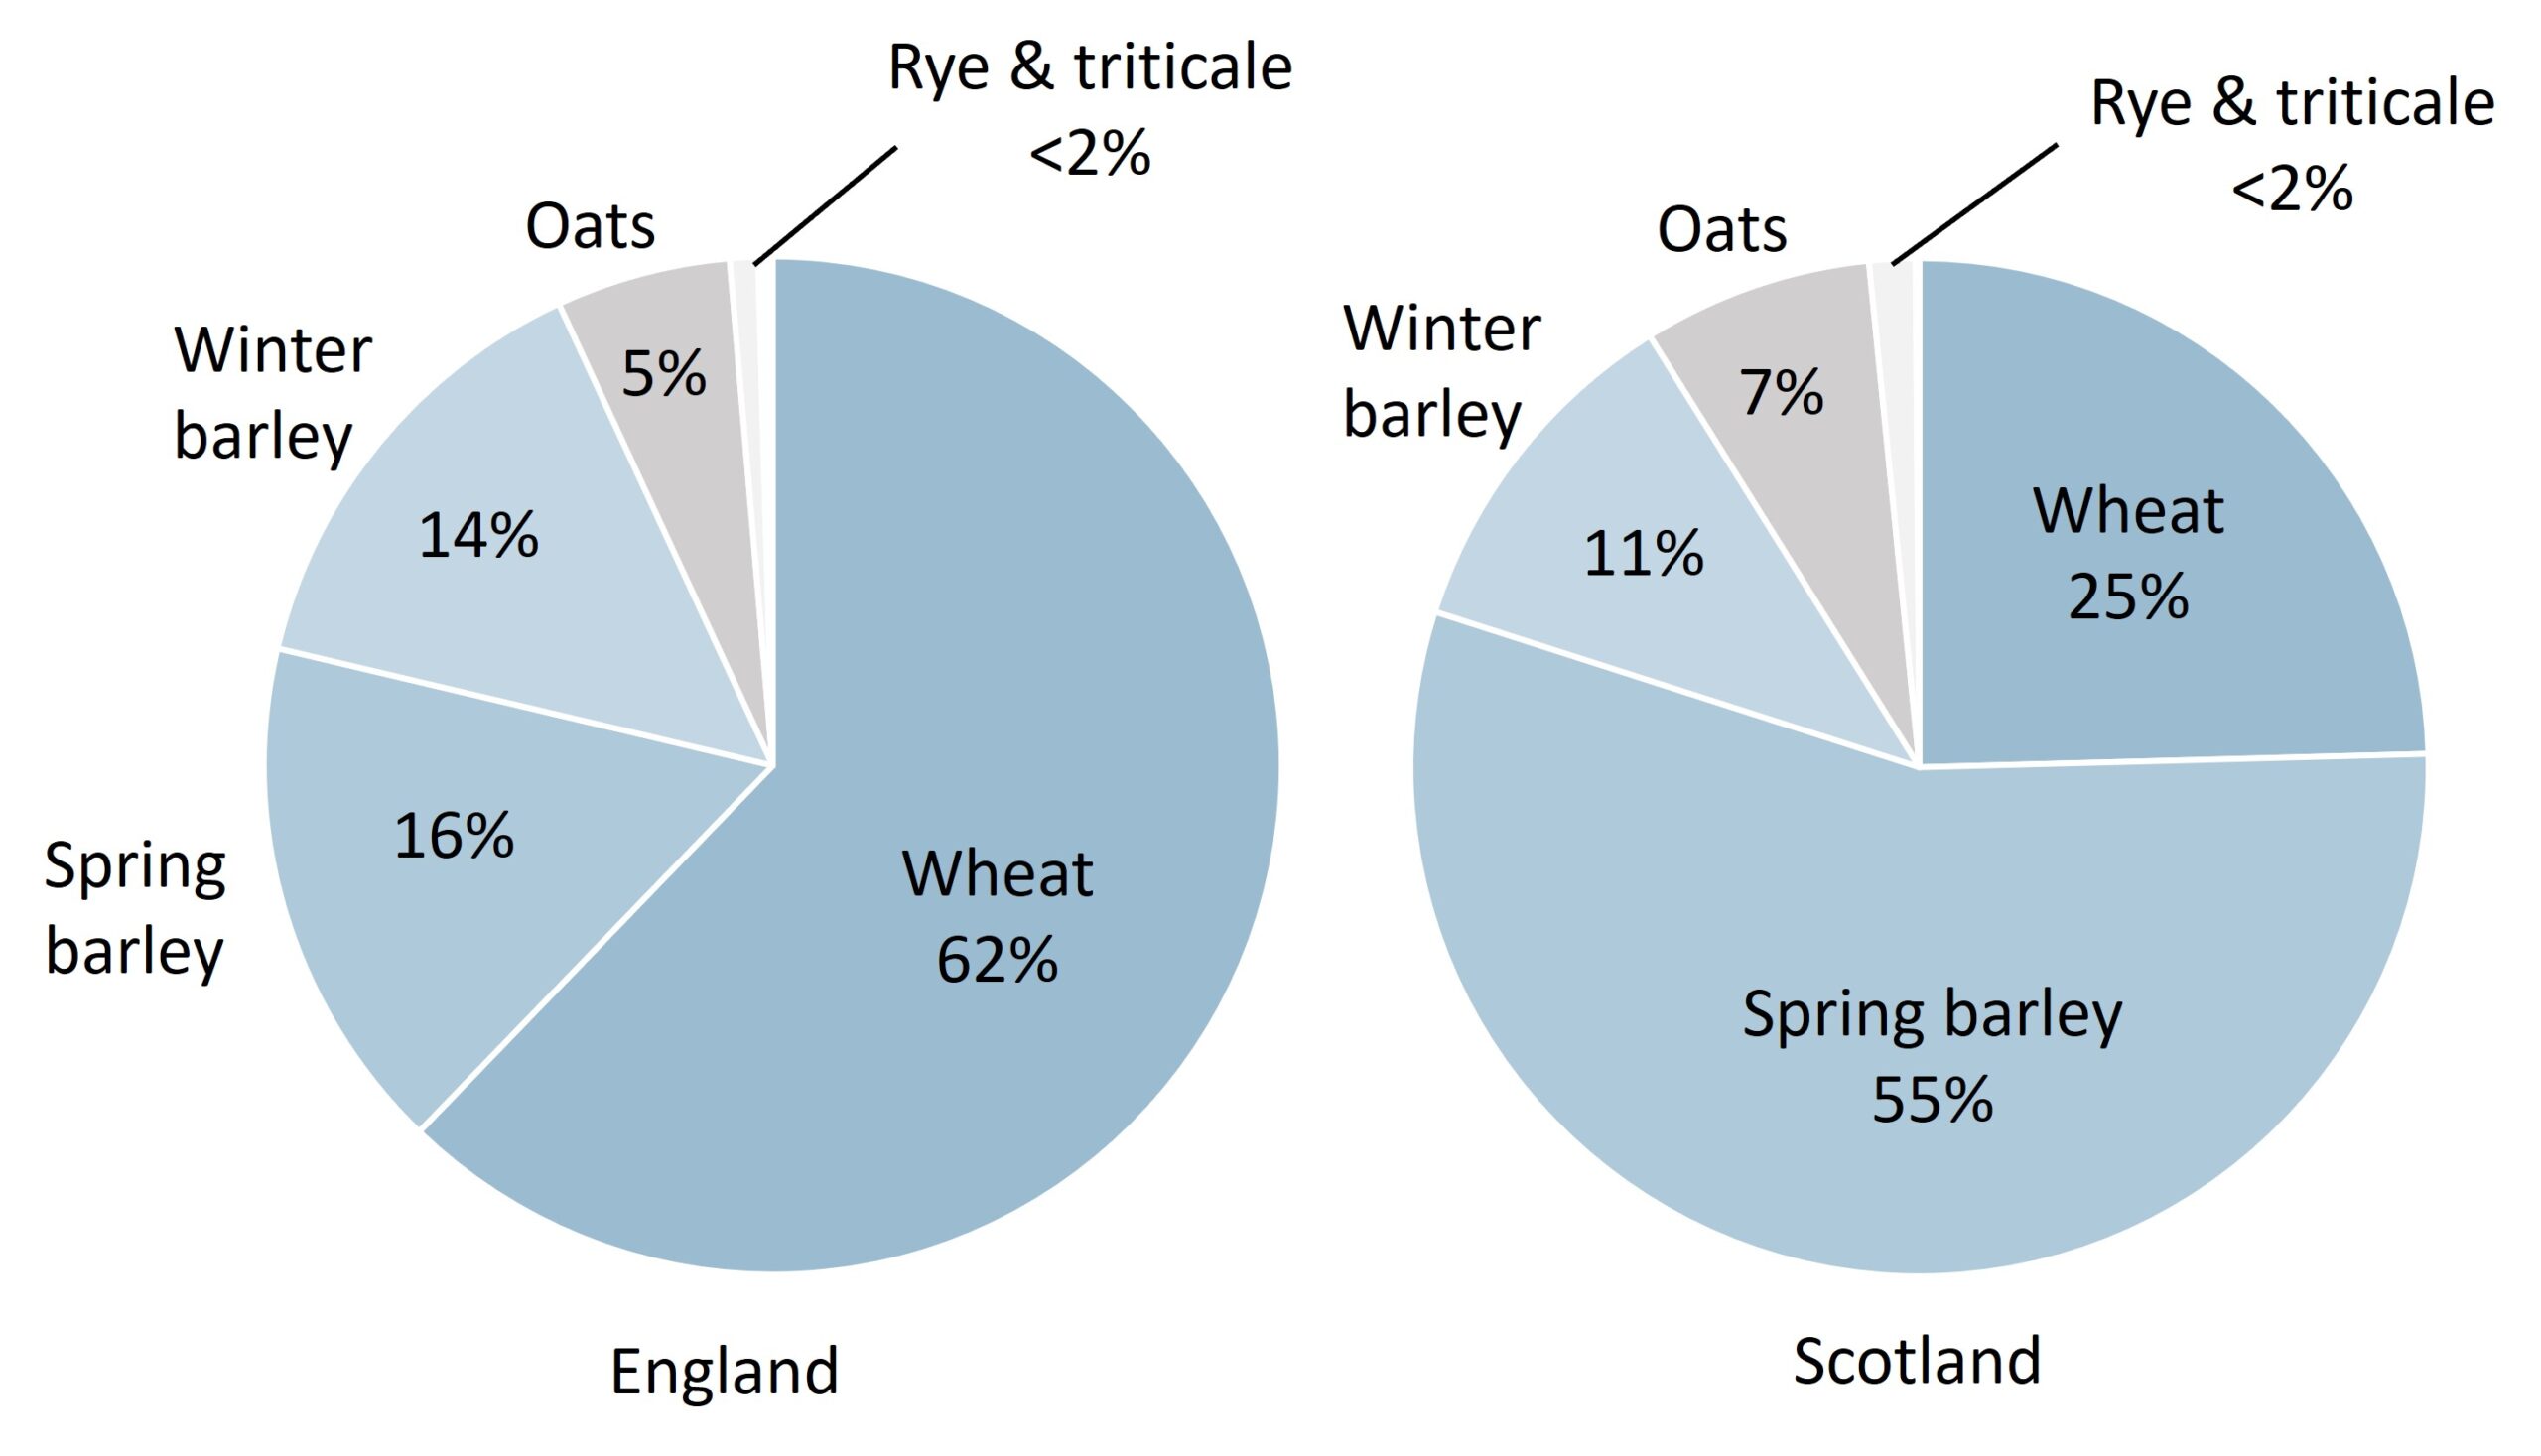
Fig. 4 Cereals grown in 2019: percentages of cereal land grown with each crop in England (total cereal area 2,694,736 hectares) and Scotland (437,258 hectares). Original data: [7].
As summarised in Fig. 1 and Fig. 3, the UK produces a small percentage of global wheat grain but at a high yield per unit field area. A recent 10-year average (2010-2019) gives total production at 14.7 million tonnes per year [4]. The harvest is sold for a range of uses, mainly livestock feed, alcohol production and milling for flour. The latter – whether for bread or other food such as biscuits – requires a certain quality of grain that comes from specified varieties [5].
But do these varieties produce enough? UK Flour Millers [6] state that in a typical year 5.5 million tonnes of wheat are milled, which is much less than the total wheat produced – the difference going to mostly alcohol and feed. Of the 5.5 million tonnes, about 15% is imported. The imports are of suitable, milling-quality wheats from Canada, Germany, France and the USA. At the same time the UK exports a proportion of its milling-grade wheat. In recent years, the proportions have varied between 2% and 20% of the harvest, mainly to Spain, Portugal and The Netherlands.
The outlook is therefore more positive for the UK than for many other countries. Wheat milling in the UK is buffered against external threats because of high home-grown production and access to safe grain supply chains. In most years, imports and exports are a relatively small percentage of home production. In addition, the UK imports and consumes large quantities of other cereals and their products, mainly rice and maize. Retailers should be able to offer a wide range of cereal carbohydrates.
Some disruption is inevitable, however. When a commodity is in short supply – or said to be in short supply – its price usually rises. Wheat occurs in many different types of processed food, sourced from a range of global markets, some of which will be disrupted in the months and maybe years to come. In addition, trade in related commodities is likely to add to the disruption. Fertiliser for example, will probably increase in price, and among UK cereals, wheat and particularly bread wheat uses the most nitrogen fertiliser.
In summary – the UK should not suffer serious food insecurity due to reduced grain supplies from Russia and Ukraine, but price and availability of some foods will be affected one way or another. (The effects of conflict on wheat products acting through other commodities such as fertiliser will be examined in a related article.)
Wheat in Scotland
Wheat crops in Scotland occupy a much smaller area than in England (Fig. 4). Production is typically 5-6% of the UK total wheat harvest. While wheat in lowland Scotland can yield more per unit field area than barley and oats (and offers among the highest cereal yields in the UK), it tends to be more sensitive than they are to poor weather, particularly high rainfall leading to waterlogged soils and flooding. Barley in particular has come to dominate Scotland’s cereal land in the past 70-80 years (Fig. 4), accompanied by the growth of supply chains in malting and livestock feed. In contrast wheat occupies 20-25% of the cereal area.
Wheat as a commercial crop in the north of the UK is generally considered more suitable for alcohol and feed than for milling (but see below for a contrary view). In recent years, the Scottish Government has been publishing estimates of ‘disposals’ – or what cereals grown in Scotland are used for. Only 9% goes for milling [Fig. 5].
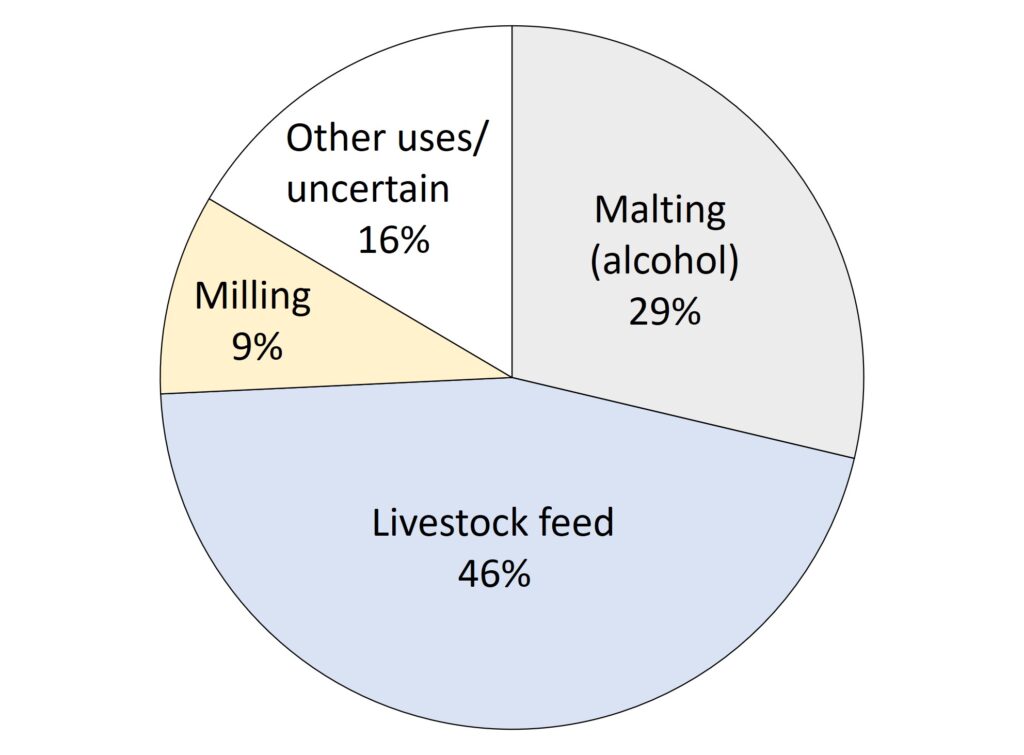
Fig. 5 Percentage of wheat harvest in Scotland in 2020 going to malting, livestock feed (to merchants and direct), milling and other or unspecified uses. Original data in [7].
At present, and despite very low home-grown production of cereals for milling, the position in Scotland over supplies of bread and other wheat-based products in the face of international trade wars or blockades is similar to that for the UK. The price and availability of some wheat-based food will be affected, but basic food security will be ensured by a combination of high UK production and imports from north America and western Europe.
A final note – the perception of milling wheat in Scotland is changing through a small but growing movement to re-introduce bread-quality varieties and landraces of wheat for local milling and baking. Scotland the Bread and Common Grains [8] are examples of what can be done to grow, harvest, mill, bake and distribute quality bread among communities. (We wish them success!)
Sources | links
[1] Food and Agriculture Organisation of the United Nations: FAOSTAT is the source of data on areas and production of crops. Various web sites give extracted summaries, for example Wikipedia. The values FAO publish on UK production are those provided by the UK government. For example, the total wheat produced in 2018 is given as 13,555 thousand tonnes in both UK and FAO publications.
[2] Exports and imports of wheat among countries are summarised in this detailed ‘infographic’ of 17 Feb 2022 by Aljazeera which focuses on those countries most likely to be affected by wheat shortages from Russia and Ukraine. Original data from the Organisation of Economic Complexity.
[3] For a general summary of the likely position regarding wheat in North America, western Europe and elsewhere: The Atlantic Council.
[4] Government web sites on UK production, usually published annually e.g. 2021 first estimates and Final crop areas, yield, etc.
[5] Agriculture and Horticulture Development Board (AHDB): properties of different varietal groups and varieties of wheat accessible online from Recommended Lists for Cereals and Oilseeds.
[6] UK Flour Millers: https://www.ukflourmillers.org/statistics and the news update Statement on UK wheat supply …..
[7] Scottish Government annual production estimates: Cereal and oilseed rape harvest final estimates – 2021
[8] Scotland the Bread‘s web pages and a Living Field article on Common Grains – Seed Sovereignty.
Author contact: geoff.squire@outlook.com or geoff.squire@hutton.ac.uk.
Further analysis of the long-term resilience and sensitivity of Scotland’s cereal production in the face of climatic and external threats is given in Resilience in a three-grain production system on the curvedflatlands web site.
[Ed: minor update on 4 April 2022]