The diagrams on Sarah’s Beans on Toast page show that at least 10 different crops are used in the brands of beans, bread and spread that were selected for this study.
The crops were haricot bean, soy bean, wheat, maize, cane sugar, tomato, paprika (or other spice extracts) and onion (or other herb extracts), oilseed rape and oil palm. If dairy products are used, then various types of grass and animal feed – and the crops from which the animal feed was made – would need to be added. There was also a range of other ingredients, including microbial cultures such as yeast.
Based on these crops, and where they might be grown, it is possible to estimate how much water it takes just to grow the ingredients for a plate of beans on toast [1].
Water use by crops and their water footprint
As plants grow they take in carbon dioxide from the air and take up nutrients from the soil. At the same time, water from the soil moves up through the plant and out to the air. This process is called transpiration. There is no way round this for most land plants. When they open the stomatal pores on their leaves to allow the carbon dioxide in, water leaves by the same route. They have to keep taking up the water to remain hydrated and able to work properly.
The reason why the location matters is that the rate at which water is transpired through the plant depends on the dryness of the air, not just the wetness of the soil. The drier the weather, the more water is lost for each unit of carbon fixed in the plant. So a crop grown in east Scotland would need less water than an identical one grown in the dry tropics.
A typical ratio of plant matter produced to water lost by transpiration is 1 to 1000. So a crop needs masses more water during its growth than it contains when it is harvested. The figure of 1:1000 is not fixed: it is larger in hot dry environments and smaller in cool moist ones. Also, the longer a crop grows, the more water it uses.

Water requirements by the crops in beans on toast
The ten or more crops that make beans on toast come from very different parts of the world. It was difficult to find out exactly where each came from, since global trade in crop products tends to combine and mix things from different regions.
However, the fact that some of the crops likely originated from the moist tropics, others from the dry tropics and still others from cooler temperate lands, means that had different needs for temperature and water.
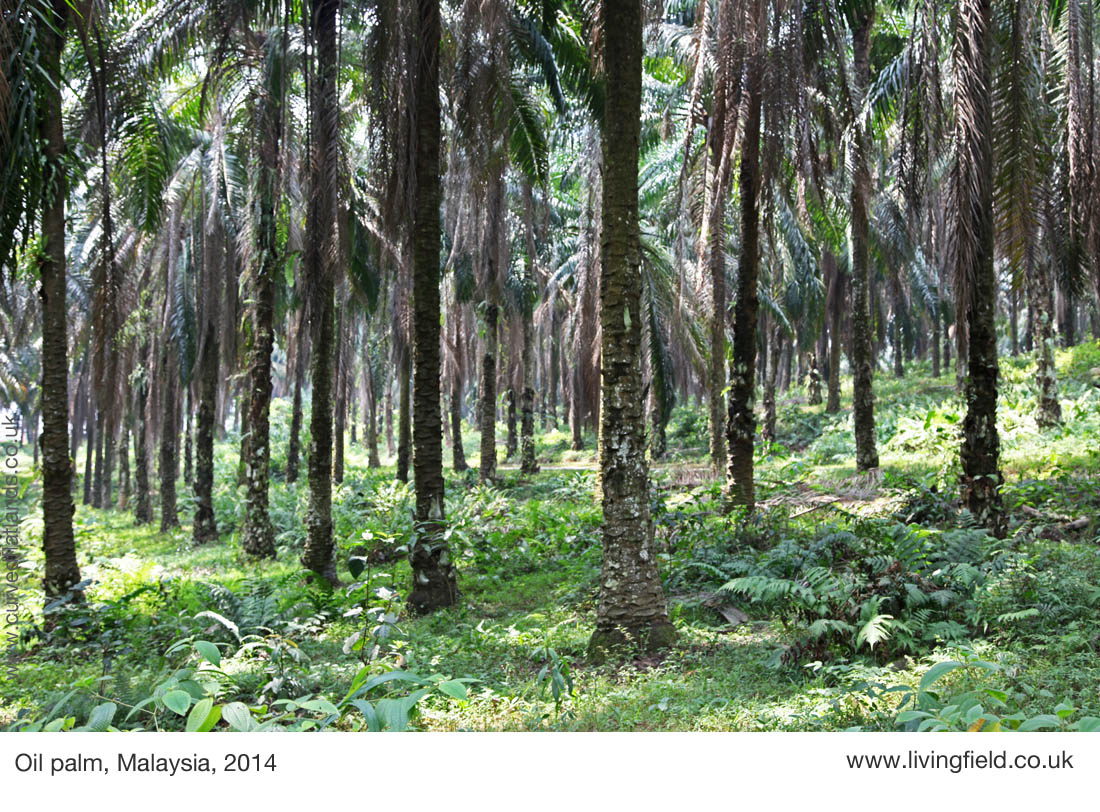
The palm oil comes from fruits of the oil palm Elaeis guineensis, probably grown in southeast Asia. This is a tropical moist region receiving about 2000 mm of rainfall a year [2, for meaning of rainfall measurements]. Rapeseed oil comes from Brassica napus, commonly called oilseed rape in the UK. It is grown in many parts of the world, but typically in regions that get at least a few hundred mm of rain but more likely up to 1000 mm. Wheat Triticum aestivum can similaly be grown in many places in cool or dry climates. Wheat and other small-grained cereals can exist on little water if they have to – wheat varieties adapted to drought (as in the photograph on this page) can yield on as little as 100 mm of rain.
Therefore the water footprint is not determined by the type of commodity – oil, starch, sugar, protein – but by the type of crop plant and its climatic needs – perennnial, annual, temperate, tropical.
Water lost by other ways
In addition to the water taken up and transpired by the crop, some of the rain or irrigation is lost in other ways. Some (often about 10% of the rain) evaporates to the air from the soil surface without going through the plant. Other drains through the soil or runs off the field as surface water.
The way a crop and soil are managed therefore have a big effect on how much water goes through the plant (and so aids its growth) and how much is lost through these other channels.
All of the channels for water can be measured for any crop in the field. Research over many years has enabled science to estimate transpiration and other movements of water at any place on the earth. There are now standard references on water use by different crops in different countries from organisations such as the Water Footprint Network [3].
Estimating the water footprint
To estimate the water footprint of beans on toast, values for the component crops were taken from the scientific literature [1, 3]. Then by knowing the weight of each main ingredient in the meal, and making a guess as to where it was grown, the water footprint was estimated for each product and calculated for the whole meal.
For a typical serving of beans on toast, with a dry weight of 120 g, the water footprint was about 450 litres, half in the beans and the other half in the bread and spread. If the meal and the water are both compared in terms of weight, then the water used was about 3,800 times the weight of the meal.
We can see what this means in bathfulls – assuming people still have baths. If a bath holds 140 litres, then more than three bathfulls of water are used to grow the crops that go into a single plate of beans on toast.
But what about all the other water used?
This figure of water footprint is very much an under-estimate of the total water used because it does not include all the water that is spent washing and processing the produce between the field and the tin or package.
You can see from the diagrams for the beans, bread and spread that water is used at many points. It is difficult to get from the companies, or from other sources, full details of how much water is used in all these steps in processing. In addition there is all the water used in transportation of the products and by all the people who had anything to do with the products.
There are many uncertainties therefore in estimating the full water footprint, but it most likely adds quite a few more bathfulls. In fact, a plate of beans on toast could keep you washed and clean for weeks.
And we did not include the water used in the washing up after the meal and in flushing human waste down the toilet when the food had passed through your digestive system.
And finally, there is nothing particular about beans on toast that gives it this large water footprint. Most meals based on a range of products will have a footprint that is several thousand time the weight of the meal.
But one thing is certain – that eating food grown locally, that has used the minimum water in processing and packaging, will have a much lower total water footprint than highly processed food grown thousands of miles away.
Green, blue and grey water
There is more to the water footprint than food. The water footprint can be estimated for anything that uses water – a house, a town, a business, a farm or a country. The water footprint is often separated into green, blue and grey water – though these names do not refer to the colour of the water. A pint of grey water has a much larger water footprint than a pint of blue or green water.
Green water
Green water originates from rain that falls from the sky, gets held by the soil and is then taken up by plants to enable them to survive and grow. As they grow, water moves from the leaves to the air by the processes described earlier.
Green water is fairly pure. It contains only the particles and chemicals that it brings down from the atmosphere. If crops are irrigated then they are also using ….
Blue water
Blue water is that stored in ponds, rivers and reservoirs on the earth’s surface and deep underground in aquifers. Blue water originates from rain, just like green water, but as soon as it runs off the field into a ditch or stream or else percolates down through the soil to the rock underneath, it takes the name blue water.
Most farming in the UK uses only green water. Only the more profitable crops such as potato and vegetables are irrigated. The farms at the James Hutton Institute grow crops on both green and blue water. The blue water is sucked up from deep below the soil through a bore hole into a water storage tank, from where it is put onto the soil as irrigation to help crops, mainly potato, when it gets dry.
If houses, business and factories get their water from reservoirs or aquifers, they are living on blue water. But most people in the world do not, they live on …..
Grey water
As water runs of the land, it picks up particles and chemical pollutants, including sewage and other waste. Its quality – and footprint – has been defined as the amount of unpolluted water that would be needed to dilute the pollution in grey water to the point where it is no longer harmful.
Today in the UK, grey water comes out of most houses and factories and down the drains. It is purified in sewage treatment works rather than diluted, but the purification needs a lot of machines, energy and people, all of which use their own water. When the treated water has acceptable levels of pollution, it is then let out to rivers or the sea.
In some regions of the UK, both the water coming out of the tap and the water going out down the drain are grey. The grey water coming out of the tap has been recycled and purified from rivers, and so has a grey water footprint.
Grey water provides most of the needs of people in many parts of the world. In some regions with poor infrastructure and sanitation, people have no choice but to use polluted water to put on their crops, drink and add to their food.
Seed to sewer – more than a meal
People eating a meal in northern Europe will likely use green, blue and grey water. The crops that went to make the meal of beans on toast used green water from the soil in their country of origin. If the crops were irrigated, it would be with blue water from a pond or river or grey water that had been treated (we hope).
The food materials would be washed and processed in a factory using blue or grey water. Water added to the ingredients to make the meal and to wash up afterwards would be blue or grey water from the tap. The washing up water will go down the sink as grey water. After a few hours and the food is digested, the excrement and urine will be flushed down the toilet to add to the world’s grey water.
You perhaps wouldn’t think that preparing and eating a simple meal involved so many different types of water, some of it falling as rain thousands of miles away. When added to the green water used to grow the crops, the blue and grey water raise the total water used to make a kilogram of food to thousands and ten-thousands of kilograms of water. It is difficult to estimate accurately the total water footprint of food, but the reports and other articles under Further information will explain how it is done [1, 3, 4].
Sources, references, further information
[1] Anyone wishing to know more or make a detailed study of water footprint will find information at the website of the Water Footprint Network: waterfootprint.org
[2] Rainfall is usually given in millimetres (mm). If a place gets, say, 1000 mm of rain in a year, then you can imagine it forming a depth of 1000 mm or 1 m or just more than 3 feet above the soil.
[3] The history, concepts and value of water footprint and green, blue and grey water are explained in The water footprint assessment manual: setting the global standard by Arjen Y. Hoekstra, Ashok K. Chapagain, Maite M. Aldaya, Mesfin M. Mekonnen. Publisher: Earthscan. 2011, ISBN: 978-1-84971-279-8.
[4] Sources for water footprint estimates: (a) Mekonnen MM, Hoekstra AY. 2011. The green, blue and grey water footprint of crops and derived crop products. Hydrol. Earth Syst. Sci 15, 1577-1600. A pdf file of this paper is available at the following link: http://www.waterfootprint.org/media/downloads/Mekonnen-Hoekstra-2011-WaterFootprintCrops.pdf and (b) Mekonnen, MM, Hoekstra AY. 2010. The green, blue and grey water footprint of farm animals and animal products. UNESCO-IHE, Delft, the Netherlands. PDF: http://waterfootprint.org/media/downloads/Report-48-WaterFootprint-AnimalProducts-Vol1.pdf
Authors/contact
Geoff Squire and Sarah Doherty (geoff.squire@hutton.ac.uk)
[Back to Beans on Toast main page]