Resilience to the 2018 drought

The 2018 summer of low rainfall was one of the driest on record. Cereal grain harvest dipped but did not fail, loss of production caused more by conditions in the previous winter than the summer drought. A further example of grain harvest’s resilience to untypical weather in the north-east Atlantic. 

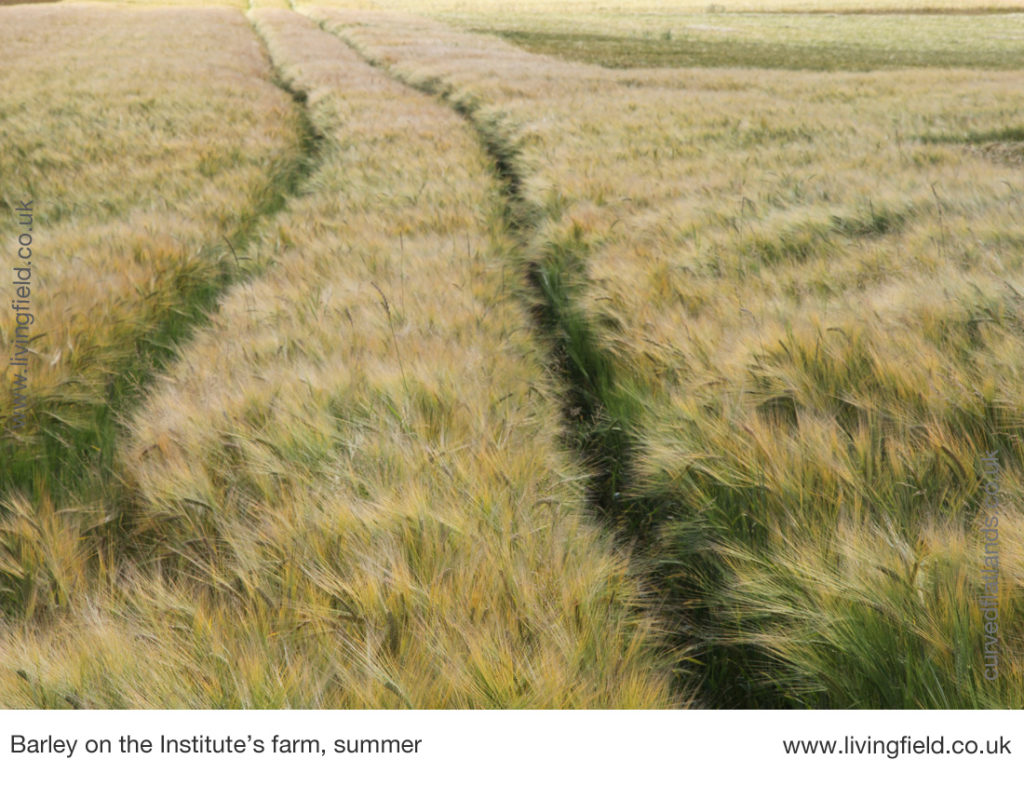
The long summer of unusually low rainfall in 2018 parched much of the grassland and stunted many of the cereal crops. The wheat and barley appeared to suffer in many places. A record low for grain output looked set to happen. Yet the yield figures suggest a remarkable resilience to what turned out to be unusual weather for the region. 

First the rainfall …. How low was it? 

Daily rainfall records for East Scotland

The Met Office provides a valuable series of historical rainfall data. The analysis here uses the daily series for regions of the UK from 1931 [1]. The Met region ‘East Scotland’ is the one where most of the wheat, barley and oats are grown.  The period in 2018 from April to the end of August joins that of several other years in being unusually dry – 1955, 1976, 1981, 1984, 1995, and 2003 all had rainfall below 200 mm (Fig. 1). 

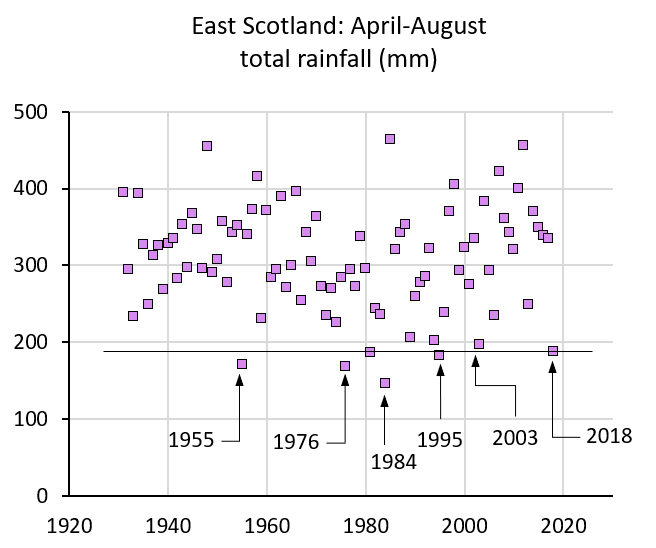
Fig. 1 Total rainfall between 1 April and 31 August for the East Scotland region in all years since 1931. The line just below 200 mm is the value in 2018. Years of low summer rainfall are arrowed. Data source: Alexander & Jones, 2001 [1].

There is little sign of any major trend in either low or high rainfall over the main summer period. Many of the other years after 2000 were much wetter than 2003 and 2018. The highest point in recent times was the very wet 2012, which had more rainfall than all other years except two. What distinguishes 2018 is the pattern of rainfall.

Many of the years having low summer rainfall had a fairly wet May, as evident in the steep rise in cumulative rainfall in 1976 and 2003 in Fig. 2. The same sort of thing happened in 1955 (not shown). This rainfall in May probably fills the soil enough to allow the crops to last through a dry June and July at which point most of the season’s growth has occurred.

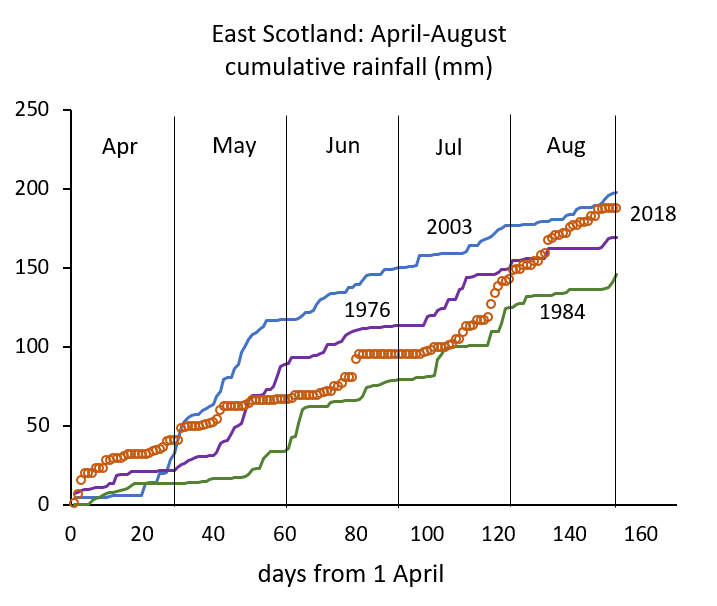
Fig. 2 Cumulative summer rainfall, East Scotland from April for four dry years including 2018 (symbols). Data source: Alexander & Jones, 2001 [1].

2018 had a wetter April then most other dry years but then low rainfall until late July. Although 1984 had the lowest rainfall overall, 2018 had the lowest from late April through to mid-July, which is when the solar income is large and when the crops are bulking. Summer rainfall in 2018 would have been less than in 2003 if it had not been for that rain in late July and early August.

So did this low rainfall during crop bulking have an effect?

Yield figures for 2018

Each year the Scottish Government provide absolute records of crop-areas (i.e. all fields counted) and estimates of yield per unit area based on data from a range of sources. The final estimates are published in December [2].

The wet year of 2012 provides a comparator: most crops but particularly wheat, oats and oilseed rape produced a low yield per unit area that year because of waterlogged soil and low solar income [3]. Total cereal output was lower than in any other year of the past two decades. 

The records show 2018 yields were no worse. Wheat yield per unit area (t/ha) was down to near the 2012 value but most of the other crops showed little fall in yield (Fig. 3). When expressed as a percentage of the average of recent years, the simultaneous dip among crops in 2012 was not repeated in 2018 (Fig. 4). 

Fig. 3 Grain yield of wheat (red), oats (black) and oilseed rape (blue) over the last 20 years.

Was anything different about 2018. Total cereal output (the sum of wheat, barley and oats) was low, in fact just above the 2012 value, but this was due to reduced land areas sown with cereals, mainly winter barley which was sown in the autumn of 2017 before the summer drought of 2018. Sources in [2] state ‘Winter barley area dropped by a fifth due to poor weather conditions. This, along with a four per cent drop in yield resulted in production decreasing by 24 per cent.’ The greater effect therefore occurred before the winter and ‘was a result of the difficult weather conditions in late 2017.’

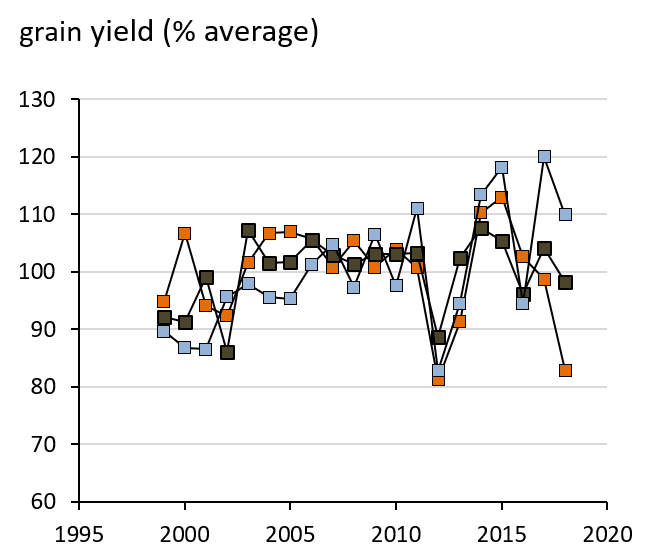
Fig. 4 Grain yields in Fig. 3 as a percentage of the average over the period, wheat (red), oats (black), oilseed rape (blue).

It appears therefore that yields per unit area – the best guide to the effect of weather on the summer bulking conditions – were not strongly affected by the 2018 drought.  

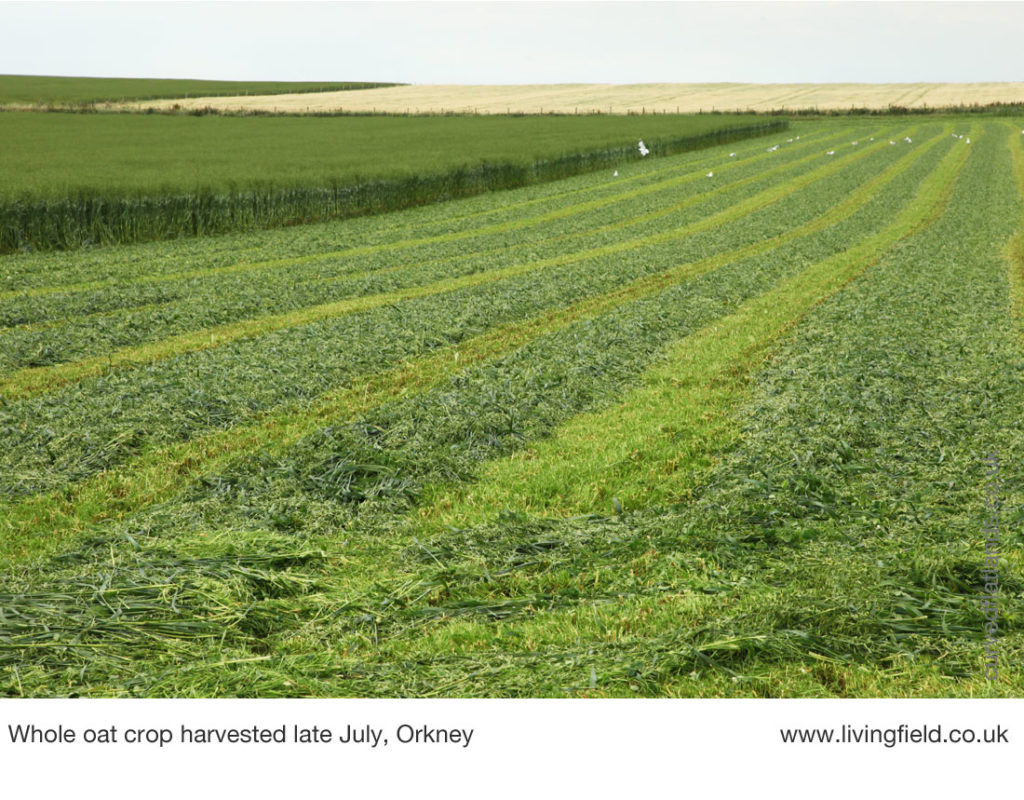
Caution is needed because the yield figures are an estimate, i.e. not measured for all crops. Some crops were not harvested for grain at all, where the weather ‘resulted in a number of farmers choosing to whole-crop due to the low yield and quality [2].’ (Whole-crop means to take all the crop for feed without separating the grain.) Some of the poorest yielding fields might have been removed from the estimate of yield therefore. 

Could grain yields collapse in this region?

Drought leads to zero crop yield in many countries. Even in parts of Australia, where standards of agronomy and resource-use are high, recent droughts have led to total failure of cereal crops that are not irrigated. 

So could crop failure occur here? In principle yes. But it would have to be a much drier year than any since the records began in 1931. Given there is no discernible trend towards low summer rainfall and that most years between 2003 and 2018 were wet, and two of those years – 2014 and 2016 – produced among  the highest mean yields ever in this region, there are certainly no indications that summer droughts will become a feature of the Atlantic maritime cropland.

Then again, you can’t trust the weather …. [4].

Sources, links

[1] Daily rainfall series from 1931: Alexander, L.V. and Jones, P.D. (2001) Updated precipitation series for the U.K. and discussion of recent extremes, Atmospheric Science Letters doi:10.1006/asle.2001.0025. Further information at the Met Office’s Hadley Centre web site: https://www.metoffice.gov.uk/hadobs/hadukp/

[2] Cereal and oilseed rape harvest: 2018 final estimates:  https://www.gov.scot/publications/cereal-oilseed-rape-harvest-2018-final-estimates/ Published 12 December 2018. See also https://blogs.gov.scot/statistics/2018/10/04/2018-scottish-cereal-harvest/ 

[3] Links to Living Field articles on high rainfall: The late autumn floods of 2012, Winter flood,  Winter flood … continued and Effects on corn yields of the 2016 winter flood.

[4] A fuller version of this article will appear on the curvedflatlands web site: link to be available later.

Author/contact: geoff.squire@hutton.ac.uk or geoff.squire@outlook.com

Three grain resilience

The north-east Atlantic seaboard has grown three main grain crops – oat, barley and wheat. All originated in the east Mediterranean or west Asia, but all find the climate here good for their growth. Most years that is.

The fall in output of the main staple grain crops in 2018, and before that in 2012, due to unusually bad weather, raised many questions as to how food and alcohol production would be affected if the climate continued to vary between wet and dry. The crop in 2012 suffered from cloudy skies causing slow plant growth, and then very wet soil that made harvest difficult. That in 2018 suffered from lack of water mid-May, at just the point when the crops were starting their main phase of growth.

Yet in neither year did production collapse. Total grain output from wheat, barley and oats fell by little more than a tenth of the average. Perhaps the varied needs of the three grains give cereal production here its ability to withstand years of bad weather. Historical change in this combination of grains may tell much about how agriculture can cope with the future.

Here, we look back over 150 years to see that the balance of the three grains and other crops has undergone major change, most of it not due to the weather, and ask whether the three grains give production some resilience – a capacity to withstand shocks, to adapt and continue.

1900: decline in grain output, a move to grass

In and around 1900, and for many decades before that, oats was by far the most widely grown grain crop in the northern part of Britain. In the crop census for Scotland [1], oats occupied more than three-quarters of the cereal area, and barley most of the rest. Wheat was minor. Few other cereals were grown – a little rye and some ‘mixed grain’ usually consisting of oats and barley.

It was a time of great change, most of it considered negative for home production. The area sown with cereals decreased as did that of the ‘root’ crops (turnips and swede) and also the grain legumes (peas and beans). They all gave way to grass, to feed cattle and sheep, with the result that the country was far from self-sufficient in grain at the time of WWI.

From privation to food security: 1945 – 1990

The areas grown with cereals and other arable crops kept on falling until the start of WWII when the need for home-grown food and feed caused some of the grass to be re-ploughed and sown with arable. The proportional areas of the three cereals remained the same, except for a little more wheat.

Yield per unit area had not changed much from 1900. Something had to happen. The privations of the war years and reliance on imports to feed the country spurred government into action. Plans were laid to raise farming output, but it was well over 10 years before there was any improvement in yield.

The phase of ‘intensification’ really began in the 1960s – machines could plough deeper, mineral fertiliser was readily available and new crop varieties were introduced able to allocate more of their mass to grain rather than straw. By the 1980s, yields had more than doubled. This result of intensification was a major achievement, reproduced in many parts of the world (The Green Revolution).

The largest single change here during that time was a shift from oats to barley and wheat. They were more profitable than oats and could now be grown to higher yield and over large areas with the fertiliser and pesticides that became readily available. Most of the wheat and about 20% of the barley were autumn-sown winter crops. They were able to survive the cold of winter and be ready to bulk up on the sun’s energy as early as May, and so were higher yielding than the traditional spring varieties.

By the 1970s, the country could have fed itself from home production, but then a rise in global trade meant that cereal food could be imported on the cheap. Home production became almost irrelevant to peoples’ consumption of cereal products except oats.

The great levelling : 1990 to the present

The seemingly unstoppable rise in grain yield slowed in the late 1980s. The brakes were on – for various reasons (which will be looked at another time). Yields per field and total grain output from the country have hardly changed since. They go up, as in the favourable weather of 2014, and down as in 2012 and 2018, but their present trajectory is level.

It’s the same for grain output in much of Europe, and crops farther afield, such as oil palm, also suffer: years of expansion and rise in output are followed by a levelling.

The levelling presents a major problem for science and crop management. 2014 gave the highest average yields ever in the region expressed as grain mass per unit field area. There is still potential for increase. The maximum on-farm yields are much higher than the average. Possibly modern varieties, able to yield well in good years, are over-sensitive to bad years.

Lessons from the past

The great swing in the mid-1900s from mostly oats to mostly barley was caused by markets and new opportunities for trade. Science and technology provided the means but the markets drove the change. Government strategy was to gain self-sufficiency in food, but that sufficiency ultimately came from outside.

There was no real strategic plan for home -grown production and there does not seem to be one now. That farming can switch between the three grains (and between grain and grass) should make agriculture less at risk of future catastrophe, whether due to climate. volcanic eruption or blockade. But the country should not wait to see what happens.

The resilience afforded by oats, barley and wheat should now be planned into the future of farming here. The Common Agricultural Policy did little to challenge current markets and the dominance of the few major influences. Post-CAP there is an opportunity to set targets for home-grown cereal food as distinct from cereals as substrates for animal feed and alcohol. Tinkering round the edges will do little. Major structural change in land use is needed.

Some previous posts on this web site have looked at the effects on crops of unusual weather in the past decade [2]. Future articles and notes will look at how farming used the three grains to the lessen the damage caused by the 2018 drought. We’ll also be starting a major series of articles on the options for future sustainability, with reference of course to lessons from the past 5000 years.

Sources, links

[1] A longer version of this article is available as on the curvedflatlands web site: Resilience in a three-grain production system, where full reference is given to the government statistical records from the late 1800s to the present and commentaries on trends in areas and yields of the three grains.

[2] Related topics on the Living Field web site: Winter flood on the water-field pages and The late autumn floods of 2012. For our general educational work on grains, see Ancient grains at the Living Field – 10 years on.

Author contact: geoff.squire@hutton.ac.uk, geoff.squire@outlook.com

[Last update: 16 March 2019, with several textual corrections! GS}

Real time virtual field – tashibunosho rice

Just over 10 years ago, the Living Field Project began to make a computer-based, virtual farm. A landscape was populated by crops and hedgerows, insects and mammals, tractors and people. The intention was to show how fields worked, how food was produced and how fields could not exist without the living things that make soil, vegetation and food webs. We exhibited the virtual farm at the Royal Highland Show, Edinburgh, 2008 [1] using computers and screens. Attempts to take it to the web ran out of funding a year or two later.

A farmed landscape, constructed by teamLab [2] and displayed at the Singapore ArtScience Museum [3] is a compelling example of learning by immersion in a virtual landscape. A screen on a wall in the first exhibition room depicts rice terraces on Kyushu Island, Japan.

teamLab’s Tashibunosho monitor at Singapore ArtScience Museum [4]

Four Seasons, a 1000 years, Terraced Rice Fields – Tasibunosho

The display is credited – 2016, Digital Work, 6 Channels, 1000 years, Artwork by teamLab. The caption reads:

“This monitor work depicts the harmonious existence between man and nature in the famed terraced rice fields, Tashibunosho in Kyushu Island, Japan. This work is generative, with the virtual world synchronising with the actual environment on Kyushu Island – weather and timings of sun setting and rising – in real time. ‘

The observer enters the room – the detail draws you in. A man leading a bullock along a path, groups of people doing agricultural tasks or eating a communal meal, a large bird (perhaps a crane) winging slowly across the landscape, clouds passing over the scene, dissolving and generating, water flowing between the fields. And humour that should appeal to all – a big frog marching along a path. It appeals to the young – they can touch!

Four clips from a 30 second phone video following a crane flying over the rice terraces (Living Field)

It is not possible to appreciate in one visit of a hour or two the changes on the monitor that must occur as days pass into seasons. teamLab explains:

“The imagery changes throughout the day; it grows brighter as the sun rises and glows with the setting sun before darkness sets in as the night deepens. Mirroring nature in many ways, the appearance of the artwork is constantly changing and no two moments are ever the same.”

There is no formal explanation of farming or food production. Yet the events witnessed are impressed on the mind. Rice crops are sown, irrigated and harvested in fields defined spatially by paths and bunds. The fields are not isolated but connected, most clearly by waterways and by farm workers with their draft animals. Nature flies or walks over or among the fields and into the surrounding low vegetative hills. The landscape is whole and connected – it is more than a set of fields.

The series of four images above left are single frames from a 30 second video taken by a phone. The video follows a large bird that casually flaps its way over the rice, each plant carefully delineated. It passes over scarecrows, overtakes a cloud. It continues past a large tree set in a clearing and around which people are seated. Finally it disappears out of the rice to the left of the monitor.

The display might provoke many points of discussion among groups of young visitors, depending on the time of year and whether rice is growing or not, for example:

  • how did the plants get there and what are they for, assuming most of the visiting children will not know where food comes from (as in the UK)
  • why are the fields set out in that pattern, why are they covered in water, where does the water come from – and what happens if it runs out
  • what do the farm animals do
  • where have the trees gone – we can only see one big one and a few smaller ones
  • where does the rice go when it’s been harvested – who eats it?
  • ….. and more …… (with thanks from some UK visitors for a unique experience)

Sources, links

[1] The Living Field’s Graham Begg and Gladys Wright designed and built Virtual Farm in 2007/08 for exhibition at the Royal Highland Show, Edinburgh in June 2008.

[2] teamLab’s web site gives examples of the Tashibunosho rice fields at https://www.teamlab.art/w/tashibunosho.

[3] More on the ArtScience Museum at Where art meets science: Singapore.

[4] The low-quality images here were taken by phone in the dim light of the exhibition hall and give an impression of the display. teamLab’s high res images can be see via [2].

Contact: geoff.squire@outlook.com or geoff.squire@hutton.ac.uk

Mashlum no more! Not yet

The mixed cereal-pulse crop known as mashlum. Decline after 1950 yet still grown in a few fields. The question of crop mixtures in prehistory.

An earlier article Mashlum – a traditional mix of oats and beans [1] suggested that the mixed cereal and pulse crop known as mashlum had died out in Scotland but no ….. an email from a farmer in Fife, Douglas Christie, confirmed that it was still grown on his farm. Here is a photograph.

Earlier we had related an account from 1925 [2] on the difficulties of growing mashlum and also the benefits. Mr Christie reports that the mixture worked very well, that chemical and nitrogen fertilizer costs were drastically reduced, but that he had to pick the field carefully as some weeds would be difficult to control.

He also overcame some of the problems in sowing and harvesting a mixture reported in earlier accounts from the 1920s. He has a drill  that can sow (direct drill) the two crops at the same time and a grain dresser that can easily separate the two crops after harvest,

Since hearing from Douglas Christie, the Living Field has noticed on Twitter that several farmers in the south of the UK are also working with mixed cereal-pulse crops. A further question arose in correspondence as to their antiquity.

Mashlum in the crop census

That mashlum merited a separate chapter in the 1925 Farm Crops [2] shows how seriously it was taken. It first appeared in the agricultural census [3] under the heading ‘vetches, tares, beans, mashlum for fodder’ between 1902 and 1919. The category in the census then changed slightly to ‘vetches and mashlum for threshing’ which declined to a low point in 1939 (grey symbols in Fig. 1). Presumably the need for fixed nitrogen during shortages caused vetches and mashlum to increase in area almost 10 times during the war years.

Most of this increase was in mashlum, which in the 1940s and early 1950s became the most widely grown legume crop in Scotland – covering more area than beans and peas – and was listed in the census simply as ‘mashlum for threshing’ (orange symbols in Fig. 1) , that is, grown and harvested for seed.   After a few years, it declined again in the early 1950s and had almost died out by 1960. In 1961, mashlum disappeared from the census and any remaining fields were combined with ‘other crops for stockfeeding’ (green symbols to the right of the trace in Fig. 1).

Fig. 1 The area sown with mashlum and related crops in the agricultural census in Scotland, 1902-1978 [3]. Mashlum was listed as a separate item in the crop census from 1944 to 1960 (orange). Before that it was part of ‘vetches, tares, etc.’ up to 1919 (light blue-grey), then vetches and mashlum for threshing (grey). Any crops remaining after 1960 were counted as part of ‘other crops for stockfeeding’ (green symbols).

The period from the late 1950s to the 1980s was the time of rapid increase in the use of mineral nitrogen fertiliser.  The cereal-pulse mix became uneconomical.

Despite its temporary revival in the 1940s, mashlum, as all other legume crops, was grown on a small part of the arable surface in the 20th century, generally less than 1% of it.

Cereal-pulse mixtures in prehistory?

A question then arises as to how old is the practice of sowing mixed  cereals and pulses. The Dictionary of the Older Scottish Tongue (DOST) finds that mashlum, in the spelling mashloche, was in use more than 500 years ago [4], but that in itself tells little of the crop’s ancestry. Was the method handed down from earlier Bronze or Iron Age  farmers to the medieval period or was it brought over by the Romans or early Christians?

The archaeological record in the north of Britain is thin on peas and beans: there is one record of field beans in Scotland  – also known as horse bean and Celtic bean, now faba bean.  Peas and beans appear far less frequently than cereal grains, but this difference is often attributed to the methods of cooking them: beans are less likely than grain to be charred and hence preserved. In an authoritative survey beans and cereals were examined in 75 locations in southern England [5].

At some archaeological sites, beans and cereals, such as emmer wheat, are found together and in numbers that suggest they were both grown as crops for food. Descriptions of the finds at Foster’s Field, Sherborne in Dorset  for example, include the line that beans ‘may have been grown as a mixed crop with barley or as part of a crop rotation system’ [6], a statement repeated in the broader survey [5].

The archaeologists agree that presence itself does not mean anything definitive about how the crops were grown – whether alone, in broadcast mixtures, or in rotation or sequence. It is not hard to imagine, though, that cereal-pulse mixtures have been used from the earliest times. Imagine a household or village had some cereal and some legume seed, not enough to be sown alone, but together they would make a field.

And the same farmers would have known, as all farmers up to the mid-1950s have known, that cereal and pulses together do better on poor soil than cereals alone because of the nitrogen-fixing ability of the pulses, and if the pulse is faba bean, then also the support offered by the stronger bean stem.

Common sense tells that they would have grown mixtures but there is no definitive evidence.

Sources, references

[1] Mashlum – a traditional mix of oats and beans posed some questions about the crop grown as a sown mixture rather than a line intercrop.

[2] O’Brien DG. 1925. The Mashlum Crop. In: Farm Crops, edited by Paterson WM, pages 297-302, published by The Gresham Publishing Company, London.

[3] Crop census records for the main crops from early in the century to 1978 are available online as Agricultural Statistics Scotland from the Scottish Government web site at Historical Agricultural Statistics. Mashlum is sometimes included with other pulses and forages but is given as a separate crop for the period indicated in Fig. 1 above.

[4] DOST Dictionary of the Older Scottish Tongue cites the crop in the spelling mashloche from the 1440s at http://www.dsl.ac.uk/entry/dost/mashloche.

[5] Treasure ER, Church MJ (2017) Can’t find a pulse? Celtic bean (Vicia faba L.) in British prehistory, Environmental Archaeology, 22:2, 113-127, DOI: 10.1080/14614103.2016.1153769. An excellent paper on the occurrence of field bean in Britain.

[6] Jones J. (2009) Plant macrofossils. In Best J, A Late Bronze Age Pottery Production Site and Settlement at Foster’s Field, Tinney’s Lane, Sherborne, Dorset.  Archaeology Data Service 2009: idoi:10.5284/1000076. Many of the source papers on the topic are only available free to academic data services, but this one is available online through the link. 

Light on bushel

When trying to work out how much grain was produced by crops such as bere, barley and oat in the 1800s, it was necessary to convert the bushel, the unit of measure that was common at that time, to the kilogram, which is the unit of weight in the modern International System (abbreviated to SI).

The bushel is a unit of ‘dry volume’ for measuring things like grain and meal rather than liquids. Farmers and grain traders  used a standard basket or barrel which when full would hold 1 bushel, equivalent to 8 gallons.  But obviously a bushel of ball bearings weighs more than a bushel of bere grain. So before it can be converted to modern units, the bushel has to be calibrated for each type of filling.

Table, jug and balance

Things used: table, kitchen measuring jug to 0.5 or 1 litre, kitchen balance (e.g. used for weighing out flour), lightweight container and  a bag of bere grain, grown in the Living Field garden, harvested and air-dried for some months. The bere grain was cleared of stems and leaves – any long awns still attached to individual grains were broken off.  The jug was filled with grain slowly. When a quarter full, the jug was banged gently on the table twice to consolidate the grain. The same was done when half full, three-quarters full and almost full. When full, the container was placed on the balance and the scale brought to zero. The grain was poured into the container and the weight noted.

In this instance, 0.5 litre of bere grain weighed 300 g (not 299 or 301).

Conversion

A bushel equals 8 gallons or 36.37 litres. So a bushel holds 72.7 of the 0.5 litre measuring jug. Since 0.5 litre of bere grain weighed 300 g, a bushel of bere should weigh 21.8 kg.

The bushel is used in some countries, including the USA and Canada, as a unit of weight and so a bushel has a different weight assigned to it for each type of grain. We are pleased to see that the USA’s standard bushel of barley is 21.77 kg, close to our estimate. Their bushel of wheat and several other small grain crops and beans is  27.2 kg while that of oat is 14.5 kg. It means wheat is heavier and oat is lighter than barley or bere for a given volume. So a person would be happier carrying two bushes of oat than two of bere.

What causes the difference in the weight of a bushel? Provided the cereals are dried to a constant moisture content, the difference lies in the proportion of the (heavier) grain to the surrounding protective husks. Wheat grain commonly falls out of the husks at harvest so the light material may not be included; oat is more husky.

Therefore when converting yields of bere in bushels, we will used the conversion, 1 bushel = 21.8 kg.

Sources, references

University of North Carolina, USA: the source informs that the previous URL (www.unc.edu/~rowlett/units/scales/bushels.html) is no longer ‘live’ and recommends a superior location at University of Georgia – ‘Weights and processed yields of fruits and vegetables‘ .

National Museum of Scotland. Photograph of a bronze bushel measure.

The International Systems of units – Bureau International des Poids and Mesures: http://www.bipm.org/en/about-us/

Note of statistical procedures: the methods reported above can be used in a fun-sized comparison of different cereals and beans. A proper  scientific calibration would check the balance with standard weights at the beginning, then repeat the procedure several times with different lots of grain from the same harvest to get an average with a estimate of the variation. If two corn crops were compared, the average plus variation would allow a statistical test of whether the two were really different.

Links on this site

The bere line – rhymes with hairline and Thorburn’s Diagrams (for grain weights in bushels).

Grain measures in Ancient Greece (measuring tables at Ancient Messene)

Author/contact: geoff.squire@hutton.ac.uk