Update on a previous post comparing spring and summer rainfall in dry years in east Scotland. By end August, 2022 was similar to other dry years but had fewer days without rain and some ‘wetter’ days with >10 mm. Conditions much worse in most of Europe where some annual crops suffered 20% loss.
In summer 2022, most of Europe experienced exceptionally low rainfall. The Global Drought Observatory [1] reported some areas were already suffering in spring – for example, parts of south-eastern France, northern Italy, Hungary and Romania. By late summer, much of Europe, including some areas in southeast England, baked in severe heat and drought (Fig. 1). Conditions in east Scotland was less severe, but still very dry …. but how dry?
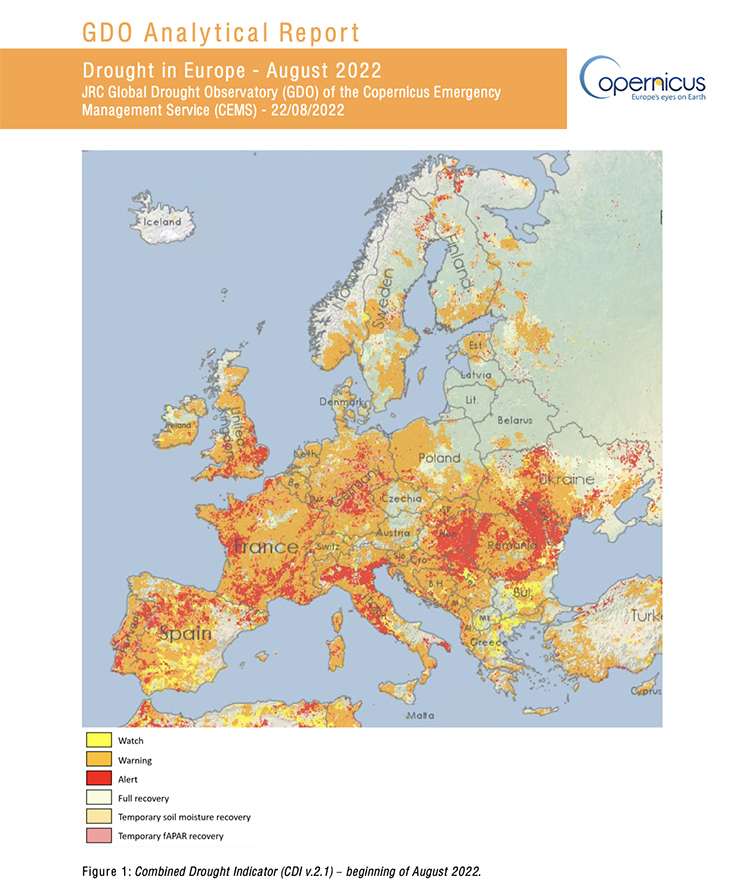
Fig. 1 From Drought in Europe August 2022 – Global Drought Observatory (GDO) Analytical Report, EU Copernicus Emergency Management Service [1]. Colours show the Combined Drought Indicator derived from several factors including weather, soil water and vegetation affected.
Summer 2022 in the croplands
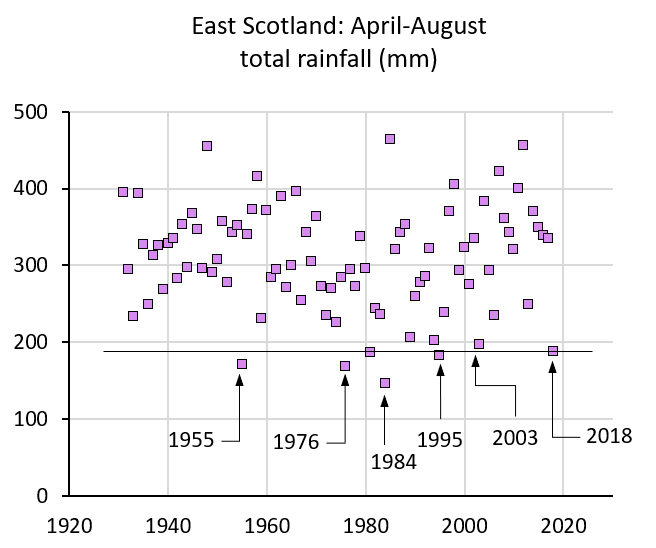
The croplands here experienced one of the drier years of recent decades, but a previous Living Field post [2] showed that 2022 up to the end of July was no drier than other recent dry years such as 1955, 1976, 1984, 1995, 2003 and 2018.
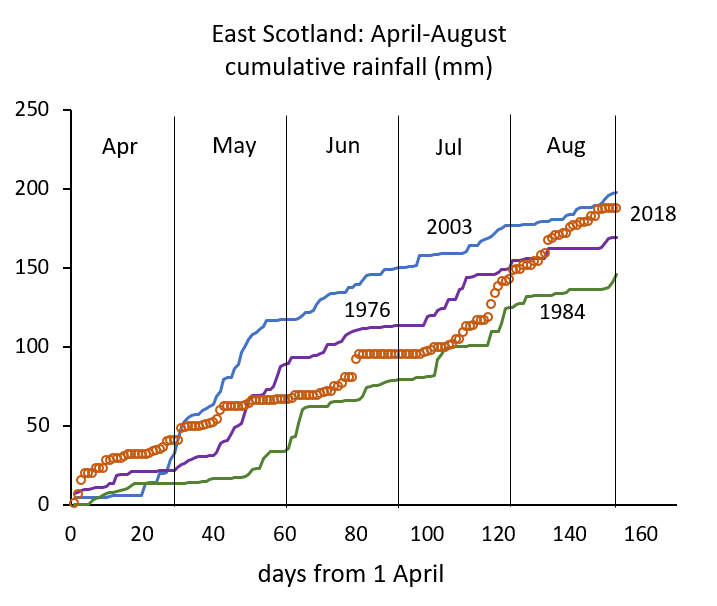
When the August records [3] are added, the position is much the same. The graph, Fig. 2, giving cumulative rainfall after 1 March, shows the years differ in cumulative rain mostly before the summer solstice (21 June) after which cumulative totals were similar. Spring and summer 2022 had similar rainfall to 2018, for example, and slightly more than 1976 and 1984. Some further rain in August raised the total to close to that for 2018 and a little above the figures for 1976 and 1984.
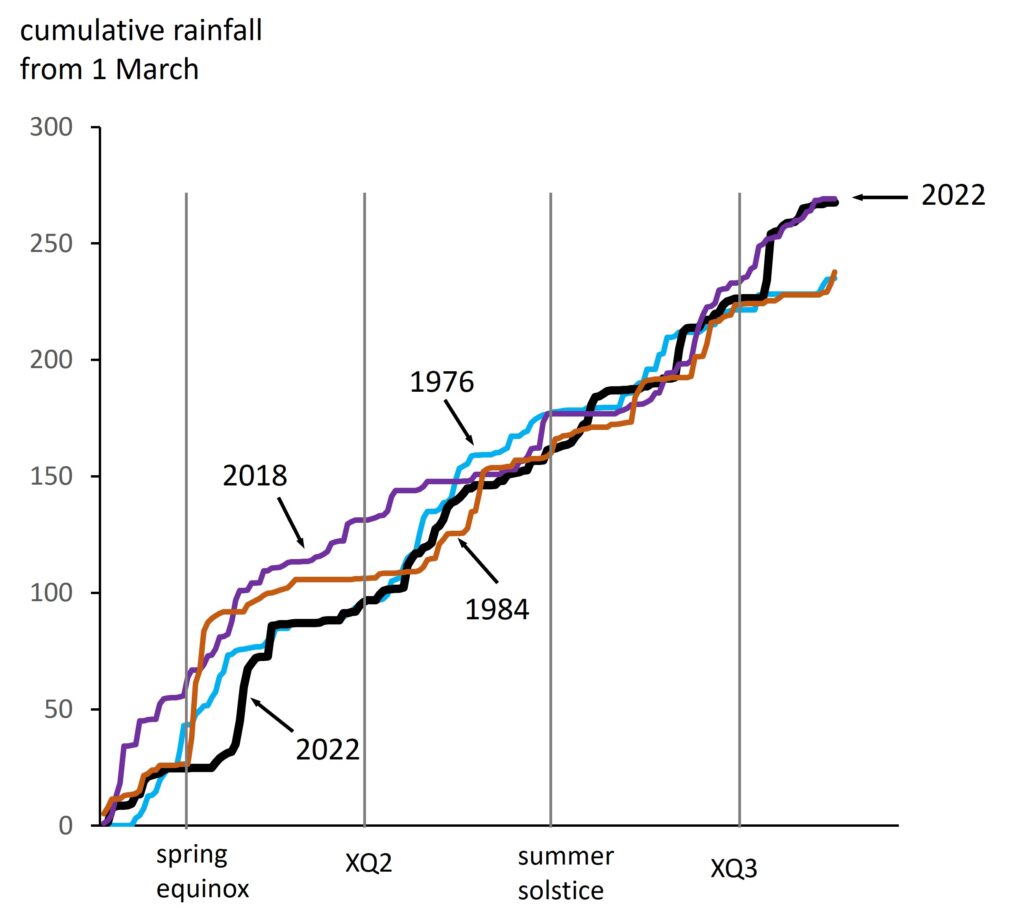
Fig. 2 Cumulative rainfall for the Met Office region East Scotland for 2022 compared to other dry years 1976, 1984 and 2018. Vertical lines show the spring equinox (21 March), the summer solstice (21 June) and two cross-quarter days (XQ2 in early May, XQ3 early August). Original data: Alexander and Jones [3].
Dry summers typically have many days with no rain or just a little rain. From analysis of regional data [3], 65-70% of days between 1 March and 31 August had < 1 mm rainfall in 1955, 1976, 1984, 1995, 2003, 2018 and 2022.
However, the distribution of rain in summer 2022 made it a little less dry than the other years. Only 20% of days had no rain. The other years had more, up to near 40% in 1955 and 1984. Also 2022 had several days with more than 10 mm of rain (Fig. 2).
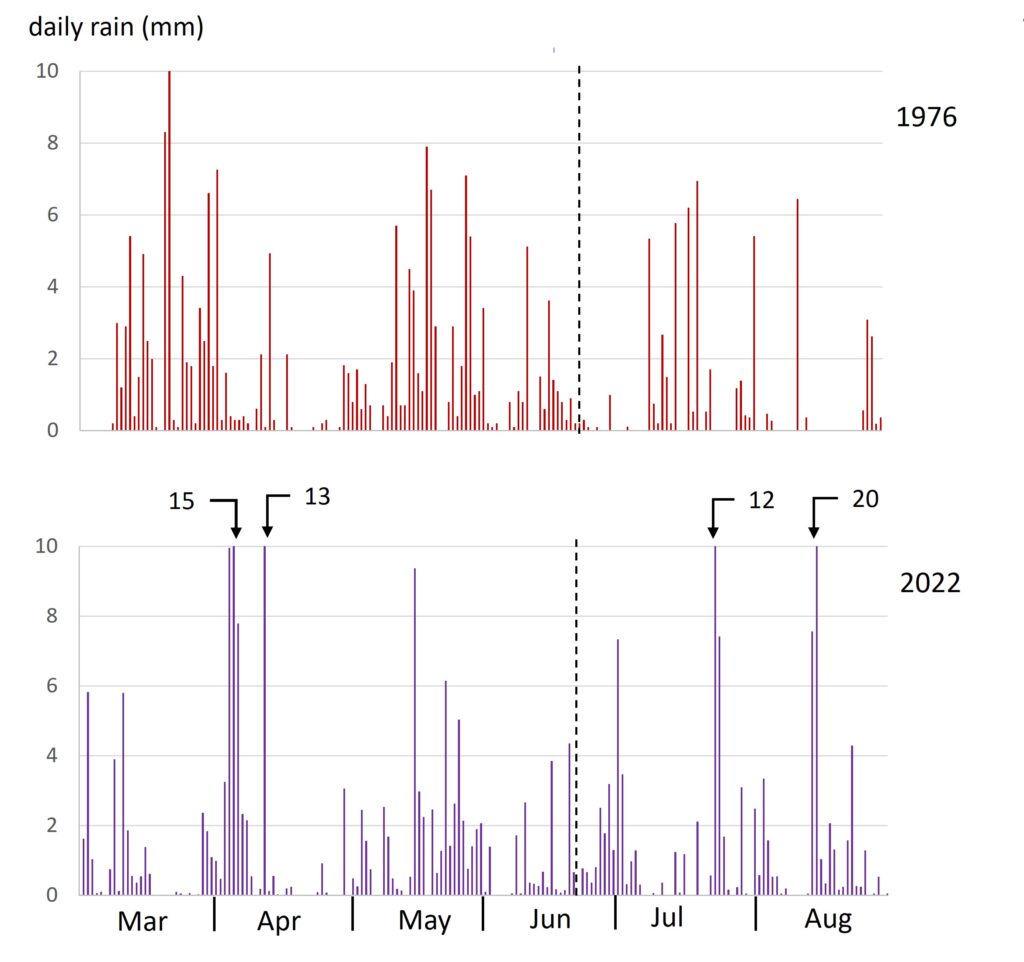
Fig. 2 Daily rainfall from 1 March to 31 August [3] in 2022 compared to 1976. All days in 1976 and all but 4 in 2022 had < 10 mm rainfall. Totals for the four days in 2022 are indicated. The vertical dashed line is at the summer solstice to allow reference to Fig. 1.
Did it affect crops and grass?
Well yes ….. but the links between rainfall and the yield of crops and grass depend on many other factors. Europe as a whole has been badly affected by lack of rain – but the continent covers such as range of climates, catchments, crops and pastures that no single conclusion can be applied to all.
The latest Bulletin on climate and crops from the Joint Research Centre [4] reports that some but not all crops have been reduced by drought. The yields of several major crops including grain maize, soybean and sunflower were reduced by 15-20% of the recent average, whereas yield of wheat went the other way – slightly greater than average. [Ed: some perennial crops may be more badly affected than grain crops – more on this in a later post].
Pastures (on which livestock graze) have been losing ground cover over the summer due to drought but are now recovering in many areas. However, not all pastures have had yield reduced by drought. For example, a higher than average rain in Ireland prevented drought, but the associated cloud cover reduced solar income to the point where it limited the growth of grass.
Nearer home?
In most years, the soil is ‘full’ of water in March. Crops and pasture use that water as they grow, but – again in most years – the water depleted is repeatedly replenished by rain. In dry years, the store is not fully replenished and goes into deficit until the rain returns in autumn.
On days with little rain (e.g. < 2 mm), the water might just wet the foliage and soil surface before evaporating directly back to the atmosphere, so it does not replenish the store.
That’s why occasional days of higher rainfall may make a difference – they replenish the store. The graph for East Scotland in 2022 (Fig. 2) shows several days having 10-20 mm of rain, much of which would have penetrated the soil and provided the crops with a few more days of transpiration, and hence growth.
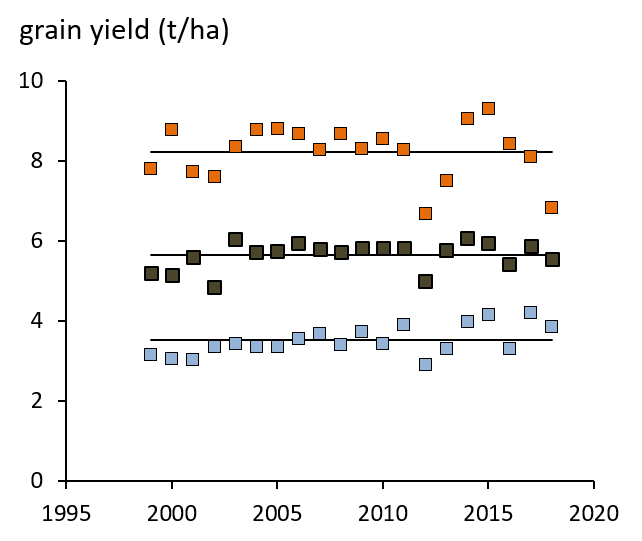
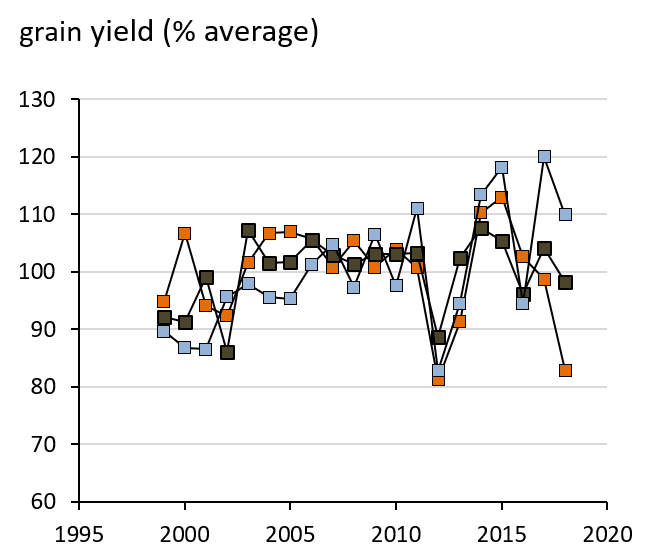
Was yield of the main crops here reduced by drought in 2022? It’s not possible to be certain without more computation based on crop cover, soil type and evaporative demand, but the provisional data from England [5] – there’s none yet for Scotland – show higher than average yield of cereals, consistent with the European JRC data cited above.
It will be instructive for future prediction of drought effects to work out how this increase in yield came about. Dry summers usually have several negative effects on growth of crops and pastures: high temperature shortens the period of growth; dryness of the soil and air reduces the rate of growth. But they can have positive effects – high temperature also allows crops to mature without loss due to wetting of the grain; and high solar income can increase the rate of growth.
If the provisional harvest data are correct, then – unexpectedly and contrary to the 1976 dry year – the positive effects outweighed the negatives.
There will be a further update when the figures for Scotland are published … but considering variation in rainfall over the past 80 years, the greater losses of agricultural output have been due to too much rather than too little rain.
Sources | Links
[1] Drought in Europe August 2022. Analytical report by the EC Global Drought Observatory, web link:
Toreti, A., Bavera, D., Acosta Navarro, J., Cammalleri, C., de Jager, A., Di Ciollo, C., Hrast Essenfelder, A., Maetens, W., Magni, D., Masante, D., Mazzeschi, M., Niemeyer, S., Spinoni, J., Drought in Europe August 2022, Publications Office of the European Union, doi:10.2760/264241
[2] On the Living Field web: 2022 Summer Drought
[3] Rainfall data used in Fig. 1 and Fig. 2 are from Met Office Hadley Centre UK Precipitation. Ref: Alexander LV, Jones PD. 2001. Updated precipitation series for the UK and discussion of recent extremes. Atmospheric Science Letters 1, doi:10.1006/asle.2001.0025. These figures are averages acrosss a region: there will be variation betwen local sites – some drier, others less so.
[4] Crop Monitoring in Europe October 2022. From the JRC MARS Bulletin (where JRC = Joint Research Centre of the EU, and MARS = Monitoring Agricultural Resources). One of a series of regular bulletins on climate and agriculture in Europe. Web link –
Baruth, B., Bassu, S., Ben Aoun, W., Biavetti, I., Bratu, M., Cerrani, I., Chemin, Y., Claverie, M., De Palma, P., Fumagalli, D., Manfron, G., Morel, J., Nisini Scacchiafichi, L., Panarello, L., Ronchetti, G., Seguini, L., Tarnavsky, E., Van Den Berg, M., Zajac, Z., Zucchini, A. and Rossi, M., JRC MARS Bulletin – Crop monitoring in Europe – October 2022 Vol. 30 No 10, Van Den Berg, M., Niemeyer, S. and Van Der Velde, M. editor(s), Publications Office of the European Union: doi:10.2760/23690.
[5] Provisional harvest figures for England, published 10 October 2022: Provisional cereal and oilseed production estimates.
Contact for this article: geoff.squire@hutton.ac.uk or geoff.squire@outlook.com
[Ed: article liable to editing ... up to 30 Nov 2022]

