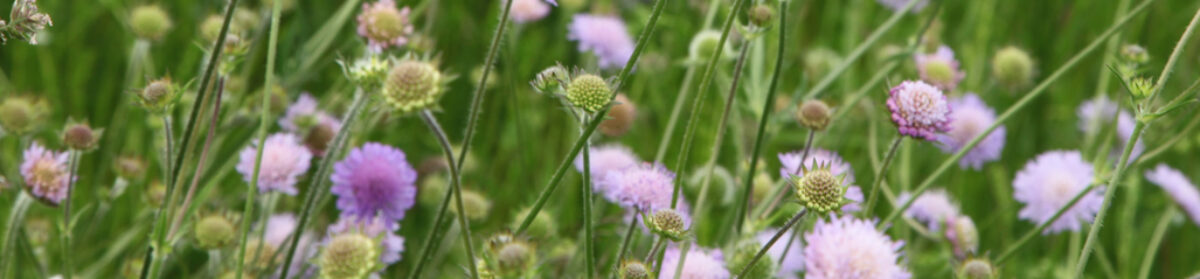
Peas and beans, and other grain legumes, have been on the decline for many decades. Archaeological records show their place in Scottish agriculture since early farming in the neolithic age. They were common once – and considered essential by some innovators such as the early Monastic farmers.
They had dual benefits – offering higher plant protein than cereal crops and enriching soil by fixing nitrogen from the air into their roots, and when the roots died the nitrogen went into the soil for next year’s crop. Despite the benefits, their growing in Scotland declined over time to a point in the 1930s where they had become rare as field crops..
Peas and beans have in recent times shown some signs of recovery as their benefits were rediscovered, especially since crop sequences that include legumes need less mineral fertiliser and hence contribute less to GHG emissions.
But it’s their value as food, in the form of peasemeal flatbreads and similar delights, that was told in a recent article by Pete Iannetta of the James Hutton Institute (reference to be added). So, as some further background, this note gives reference to peas and beans in crop rotations found in written sources from the 1400s to around a century ago.
Monastic enforcement
Many agricultural innovations were introduced in the centuries following the spread northwards of Christian religious houses from their base in France and southern England [1]. The monks’ stipulations, as related in Franklin’s (1952) account [2] of the Act of 1457 and later, read like a recipe for regenerative farming today – planting trees, hedges and broom parks, sowing crops such as wheat, peas, rye and beans in rotation (Act of 1472), and removing noxious weeds like corn marigold [3].
Franklin [2] states that – while the Acts were ‘almost universally disregarded’ – the Monks of Coupar inserted in their leases to farming tenants ‘a clause which ran roughly as follows’:
“And the said — shall put the land to every improvement in his power in building and fencing and planting trees, that is ashes, osiers, birch, willow and broom, with hawthorn fences and protection for them. And he shall keep his land free from corn marigold, and shall keep the acts of parliament in sowing wheat, peas, rye and beans, and shall labour for the gaining of the marsh.”
The gaining of the marsh presumably refers to wet boggy land generally, but more specifically to the Carse of Gowrie (south of Coupar and between the Sidlaw Hills and the Tay estuary), which as a result of that drainage and subsequent maintenance became one of the most productive agricultural areas in Scotland [4]. And it is also notable that the leguminous broom, and in other sources the leguminous even if spinous gorse, were cultivated as fodder crops, a practice that continued to within the last 100 years.
[2] Franklin, T Bedford (1852) A history of Scottish Farming. Thomas Nelson and Sons Ltd, Edinburgh (and London, Melbourne, Cape Town, Toronto, and New York).
[3] The corn marigold or gool(e), now a rare plant of cropland, was once considered a noxious weed, the toleration of which was considered a crime: link to the Living Field article – Gool rider, Gool rider.
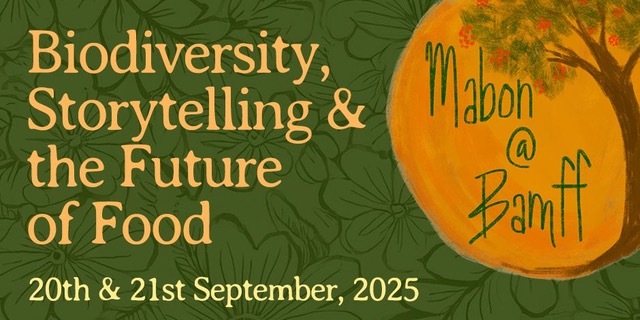
Two events are coming up in September 2025 aimed at young people who want to know more about green careers, make contacts in land and food and learn new skills.
Mabon @ Bamff | 20-21 September | PerthSHire
Mabon is the follow on event to the highly successful Beltane held in 2023.
When: 21 and 21 September 2025 (Sat/Sun). Where: Bamff Estate, Perthshire, a few km NW of Alyth, Strathmore. Who: event run by Rosanna Harvey-Crawford (SEDA Land) aimed at young people (18-40)
“Do you work in sustainability, conservation, or food systems? Are you interested in learning new skills and connecting with like-minded folks? Join SEDA Land on 20-21 September for an event focused on biodiversity, storytelling and the future of food, held at the beautiful Bamff estate in Perthshire – the site of an ongoing rewilding project.
Mabon @ Bamff includes workshops on tree seed saving, dry stone walling, storytelling, and ecological surveying. You can go on a guided walk of the estate and (hopefully!) see beavers. On Sunday, there will be a panel discussion on the future of food, featuring inspiring speakers working on different aspects of food system transformation. This is a chance to learn, be creative, enjoy being out in nature and feel inspired.“
A careers fair will be run by the Scottish Ecological Design Association (SEDA) at Glasgow University Union on 24 September 2025. Gail Halvorsen from SEDA writes:
“This is shaping up to be a very different careers fair from usual, showcasing both innovative and traditional opportunities in areas including renewable energy, regenerative farming, bioproducts manufacturing, green health and environmental law. It will showcase small and medium-sized enterprises to highlight the full range of green jobs available to graduates. Only people or firms run along ecological lines will be invited.”
SEDA is looking to hear from people who would like to contribute to the fair, for example representing a green industries sector.
Developments on the 50th anniversary of the Aberfeldy Manifesto. Now, as then – call to governance on the need for food self-sufficiency, care of the soil and minimal environmental impact. Spreading the knowledge. The pioneering Dr Walter Yellowlees and the Aberfeldy Group in the 1970s.
The Healthiest Town Team from Aberfeldy in Perthshire held an open event on 24 August 2024 to commemorate and revisit the Aberfeldy Group Manifesto on its 50th anniversary [1]. The Group’s statements and aims are still very relevant today: the country remains food insecure, its soils are degrading and pollution continues.
Bioregioning Tayside decided to develop the 1974 manifesto into a challenge for today as part of their Recipes for Action programme [2]. And to define what needs to be done, they want to know the views of the people of Tayside on issues such as food security, local production vs imports and safeguarding the environment.
A Food Manifesto for Tayside
Bioregioning Tayside writes [3]: “Reading (the manifesto) today, the points are still as relevant, and even more urgent. 50 years ago, people didn’t really take it that seriously. Now, though, the impact of climate change and biodiversity collapse means many more people recognise that they were right about the concerns they raised. So, with the help of Aberfeldy Healthiest Town we are looking again at the Aberfeldy Manifesto and using it as the basis for a modern Manifesto, which we can use as a mission statement from Aberfeldy to Arbroath, and beyond: A Food Manifesto For Tayside!
“We are asking people across the community for their views, from primary schools to community growers, policymakers, and farmers. We’ve created a very short survey to capture your views. Looking at the Aberfeldy Manifesto, what comments or changes would you make?” There’s further explanation and links to the online survey at [3].
The Aberfeldy Group manifesto oF 1974
The Manifesto opens with a view of the state of Britain in the 1970s and the pressing need to strive for self sufficiency. It gives three warnings (transcribed from the newspaper cutting above):
In the face of increasing world population and dwindling food stocks no country can have security without producing to the utmost food from its own land for its own people.
Any country which is dependent for its standard of living on the whim of money-lenders can have no true independence.
When nations over-develop their industries and neglect the husbandry of the soil, the quality of life of that nation sooner or later deteriorates.
And four objectives:
To urge by every means possible government policies which will enable our agriculture and horticulture to make Britain self-supporting in essential foods and in the requirements for their production.
To grow in the land of the upper Tay Valley as much food as possible in as much variety as possible for consumption by those living in the valley, and for sale of surpluses to any who want to buy.
To achieve these objectives without impairing soil fertility for the future, without polluting our surface waters, and without the extravagant use of fossil fuel energy.
To spread the knowledge of the relationship between soil fertility, food and health.
Walter Yellowlees of Aberfeldy
The GP for Aberdeldy and area – Dr Walter Yellowlees – was a lead actor in the Aberdeldy Group [4]. He recognised then that the physical and mental health of the people was inextricably linked to the quality of their food and the means to grow and prepare the food.
‘Ill fares the Land’ is the title of his presentation at a scientific meeting in 1978 [4]. He stressed the increasing disconnection between people, agriculture, soil and land, and urged that the connections would have to be restored for the country to achieve food security.
Ed: The arguments in ‘Ill Fares the Land’ are more pressing today than in the 1970s.The deficiencies are not in technical knowhow but in getting the four spheres – political, economic, social and environmental – to connect and work in unison.
Sources | Links
[1] The commemorative event for the Aberfeldy Group Manifesto was held on 20 August 2024 as part of the Open Gate Festival.
[2] Thanks to Ruth Watson, Kevin Frediani and Clare Cooper of Bioregioning Tayside for giving the Living Field several links and background stories to the Aberfeldy Group Manifesto and its lead Walter Yellowlees [4].
[4] Kevin Frediani (Dundee University) sent the link to this written version of The James MacKenzie Lecture 1978 by Dr Walter Yellowlees, General Practitioner, Aberfeldy, Perthshire: Yellowlees, W W (1979) Ill fares the land. Journal of the Royal College of General Practitioners 29, 7-21. Available online at journeytoforever.
Bere may well have been grown for thousands of years in Orkney but, for this ferry-louper, it was a revelation. I was lucky enough to work as a journalist in the Northern Isles in the 80s and 90s and was first introduced to this local grain with a long history when reporting on new developments at the Barony Mill, in Birsay, for BBC Radio Orkney. Back then, as a cub reporter, I didn’t really understand at first just how important bere was to the living culture of the community, nor how vital the mill was to its survival.
Some months later, I was out walking my dog across the hills near my home overlooking Stenness, just a few miles from the mill. The Orkney scenery was doing its thing: big skies, big seas, hares getting up ahead of me, whaups rising (their distinctive cries still transport me north when I hear them today) then, as I came back down a track towards a farmyard, I heard a shout! Some young cattle were being moved. One had dodged past the farmhand and was heading for me – and the vast acres of open hills beyond. There was a look of desperation on all the faces looking at me, they knew there would be many hours of work to get the young beast back and I could tell they didn’t hold out much hope that this wee quine would be much use at stopping the escapee. Happily, my dog was a rottweiler, a drover’s breed with a bold eye. She was, of course, on a lead and was used to cattle, as was I. As the cantering stirk bounded towards us, my dog seemed to double in size as she set herself before me and I waved my other arm, gamely. To everyone’s relief, the prospect of a byre and some hay suddenly seemed more appealing than the hills and the young beast trotted back to the safety of the yard.
I found myself warmly invited into the farmhouse and was soon sitting at a table filled with baking and much tea. In front of me was a fresh bere bannock, something I had never tried before. I popped a wee dollop of home-made jam on a warm crust, to everyone else’s surprise. They hadn’t realised that I had no idea what I was doing and gently suggested it would go better with some of the Orkney cheeses, which also were on the table. They were right, of course. The sharp, bitter taste of the bannock was slightly overwhelming and entirely unsuited to sweet jam, but went very well with the cheese.
I always thought it was the bere which gave the bannock that distinctive flavour and dense depth, so was astounded to try it in bread recently and find it is as meek in flavour and as soft in texture as wholemeal flour, but with all the additional health benefits of the bere, beta glucan being one example. It is much easier to find Orkney bere as more outlets now sell Barony Mill flour, so my adventures with bere, and the happy memories that little grain evokes for me, continue.
Contact Ruth Watson: ruth@watsonconsultants.scot. Ruth is a journalist specialising in food, drink and agriculture. She is food and drink ambassador for Bioregioning Tayside.
Ed: many thanks to Ruth for sharing these early experiences of bere and Barony Mill in Orkney well before the Living Field’s interest in the bere crop and flour.
North Coast Visitor Centre, Thurso Caithness. Museum, gallery and exhibitions: Pictish Stones, the botanist Robert Dick, the Flow Country, prehistory, crofting; Dounray. Superb local museum ….. and … the Northern Pilgrim’s Way, recreating the Skinnet Stone.
The North Coast Visitor Centre in Thurso opened in 2022, replacing Caithness Horizons which closed in 2019. The old Thurso Town Hall and Carnegie Library have been adapted for their new roles. Much more than a typical visitor centre, the NCVC displays stone carvings of global significance and wide-ranging museum exhibits and galleries, all housed in the centre of Thurso.
The Visitor Centre occupies several floors. The Gallery space (left) on the upper floor, is flooded with natural light. Other rooms held various displays and more permanent exhibits.
When visited in early September 2024, the gallery housed an exhibition by local artists. One of the works, by Juliette Currams, was titled Women not Witches, with the description:
“A reflection on the representation of women who were convicted of witchcraft in the 17th and 18th Century and an acknowledgement that they were just women who were different in some way and were unable to speak for themselves or engage in any kind of fair judicial process. Represented in charcoal and watercolour on paper. Then burnt and broken, as were the women in life, to extract false confessions.”
From the Material Matters exhibition at NCVC: Women not Witches by Juliette Currums
carved stones gallery
Two major Pictish stones [2], both highly weathered, one defaced but still magnificent, are now displayed with several other carved stones in a gallery on the ground floor. They are there for all to see, safe from further damage that over the centuries removed or obscured some of the carving.
Images above: Gallery displaying a range of carved stones, notably the Skinnet Stone and the Ulbster Stone (left) with examples from the Ulbster of the Salmon, the Pictish Beast and the Crescent and V rod. Images below: the Skinnet stone .
Both were found at churches in Caithness. The Ulbster is dated to the 9th century, the Skinnet to the late 9th or 10th century. They had been used in recent centuries as building material or grave slab. Their value was not appreciated and both suffered.
Today, Pictish carved stones are highly valued by historians, artists and carvers, and by people in general who can wonder at their construction and the meaning of the carved symbols. A replica of the Skinnet is being carved by a stone mason for display outdoors on the Northern Pilgrim’s Way (see below).
Robert Dick | botanist
A room in one of the upper floors tells of the life and legacy of the self-taught naturalist Robert Dick [3]. From his base in Thurso, where he worked as a baker, he explored the coast and countryside, noting the geology, the plants, including mosses and ferns, and invertebrates such as molluscs and insects. He collected and classified many specimens.
He discovered fossils of an extinct fish Microbrachius dicki, named after him, which is the earliest vertebrate to reproduce by internal fertilisation (rather than by eggs laid outside the body).
His work was recognised and praised by Hugh Miller and a range of academic scientists, but was little appreciated by local people, at least not before he died on 24 December 1866.
His collections of fossils had to be sold in later life and those of insects and shells are lost. The task of preserving his 3000 herbarium specimens, many now damaged, has begun with funding from museum groups and charitable trusts [4]. Examples are on display at the NCVC.
The exhibition on Robert Dick, including information on his life, the task of restoring and curating his collection, and specimens on display under glass and in cabinets (www.livingfield.c0.uk).
Heritage evolving
Interest and activity in the archaeology, history and nature of Caithness continues to grow, dispelling the perception of some early writers of the place as only a bleak, peaty wilderness.
The land and people around Thurso have been linked for millenia to other parts of Scotland and to a much wider world. Hundreds of years ago the country was traversed by pilgrimmage routes between the Christian centres of Tain to the south and the Orkney to the north. In recent years these routes have been mapped, opened and re-marked by the Northern Pilgrims’ Way Group [5].
The Group has commissioned Dave McGovern of Monikie Rock Art to carve a replica of the Skinnet Stone to be erected on one of the routes [6]. The original was made from sandstone, but no local quarries have survived that could supply similar material. So the slab for the replica was sourced from south of Hadrian’s Wall. Weathering had obscured the detail of the original in parts but careful examination of the stone revealed the shapes of two hippocamps (upper body horse, lower body fish).
Many great developments therefore in and around Thurso – heritage alive.
Author/contact for this page: geoff.squire@hutton.ac.uk or geoff.squire@outlook.com
[2] Ulbster and Skinnet Stones: information and photographs at the Canmore web site – Ulbster and Skinnet.
[3] Robert Dick botanist, brief notes: Undiscovered Scotland and Electric Scotland. Biography: Smiles, Samuel (1879) Robert Dick, baker, of Thurso, geologist and botanist. Available free online at several sites including Biodiversity Heritage Library, and Internet Archive (search author). And an update in a scientific journal: Saxon, J., Bramman, J., Campbell, N. Some New Material on Robert Dick, Baker of Thurso, Geologist and Botanist. Nature 210, 253 (1966). https://doi.org/10.1038/210253a0.
[5] Northern Pilgrims’ Way. The Pictish Arts Society held an online event in October 2024 in which Jane Coll described progress with regenerating the Northern Pilgrims’ Way: www.northernpilgrimsway.co.uk. Book: Jane Coll (2022) In their footsteps – exploring a Northern Pilgrimage Way, Kindle Books (search the web for sellers).
[6] At the same event, Dave McGovern of Monikie Rock Art described constructing a replica of the Skinnet Stone. To follow progress with the carving, try their Instagram and Facebook pages.
The exhibition – Farming Fit for the Future – at Alyth Museum [1] in Perthshire shows how some farmers in Strathmore are regenerating the health and productivity of their land for a sustainable future.
[In progress – liable to editing 7 August 2024]
Agriculture here has a history of several thousand years. It has been through many cycles of decline and renewal. Some of the most effective changes in recent centuries –the Improvements – were introduced over several decades followed a devastating run of severe weather and resulting privation in the 1690s. The state of agriculture was later documented by farmer Andrew Wight on journeys beginning 1773 around mainland Scotland [2].
The Living Field looks back 250 years to the time of Mr Wight’s journals. What did he see as the main innovations or improvements in this part of Perthshire and Angus and how do they compare to the changes in land management described at the Alyth exhibition?
First – a look at the extent of managed agricultural land today, in Strathmore and beyond.
areaS of arable and managed grass TODAY
The agricultural census [3] records the area of land within several broad catagories. Arable or tilled land is typically ploughed and sown with cereals and other annual crops such as oilseed rape, potato and vegetables. Grassland, managed as grazing or hay for livestock, is separated into short-term (grown for less than 5 years) and long-term grass. A third broad category and the largest area, known as ‘rough grazing’, occupies mainly higher ground including the lower slopes of the hills. The main areas of production are the arable and managed grass.
Fig 1. Areas of arable land and managed grass (green colouring) in the early 21st century [4]. The dashed line shows the approximate position of the Highland Boundary Fault.
These categories are not permanent. Traditionally, and today still in some areas, short-term grass is sown as part of an arable-grass sequence. Also, land can switch between arable and grass – for example, large areas of arable land were moved into grass as recently as the 1980s and 1990s.
Arable crops and grass are cultivated mainly in low-lying regions to the east and south of the country, but they extend to parts of the far west and north (Fig. 1). For the western islands and much of the west mainland, thin strands of agricultural fields trace the boundary between land and sea.
At the east-centre of the mainland, the cultivated land is delimited by the Highland Boundary Fault (approximated by the dashed grey line in Fig. 1). Arable and grass occupy lower elevations to the south of the Fault. Rough grazing and non-agricultural land extend to the north. The climate and soil to the south of the Fault support a diverse agriculture which by global standards is highly productive.
Strathmore runs north-east from just above Perth, towards Alyth and on to near the coast. The Living Field post – Can we grow more vegetables? [4] shows the topography and boundaries of the strath, while Feeding the Romans [5] describes the line of watch towers, forts and fortresses that the invaders built just south of the Fault.
Figure 2. Arable and grass fields in productive land mostly to the south of the Highland Boundary Fault (see Fig. 1) in Perthshire, Angus and Fife. Letters show (D) Dundee, (P) Perth, (A) Alyth and (M) Montrose. Coloured dots indicate centres of fields growing mostly arable (dark grey) and grass (light purple).
North of Alyth on Fig. 2, it looks as if the productive land in Strathmore is putting out ‘feelers’ – testing the conditions in the expanse of unproductive white. But these thin strands are formed by fields immediately adjacent to the rivers that flow down through steep sided glens (valleys) across the Fault and into Strathmore. The boundary between land and sea is not shown on the map, but the fields define the coastline, including the shape of the Tay estuary between Perth and Dundee.
The copious supplies of water from the north and the rich soil south of the Fault, together with the maritime climate of this region, give Strathmore its great capacity for agricultural production. Farms in the exhibition [1] lie mostly in the arable-grass but some extend to higher elevations.
Improvements by the late 1700s
A major, systematic change in land management in lowland Scotland was stimulated during the 1700s by the ideas and methods of wealthy landowners such as Henry Home (1696-1782) and John Sinclair (1754-1835). They were unsure as to how far their innovations had been taken up by other landowners and their tenants. So to get the evidence, Andrew Wight, himself a farmer, was commissioned to ride around Scotland, visiting innovative farmers and documenting their methods and results. His findings were published in 1778 and 1784 [2].
[To be continued with …..the course of Mr Wight’s travels in Strathmore, his views on farming’s capacity to change …. ]
Author / contact: geoff.squire@hutton.ac.uk or geoff.squire@outlook.com
Sources | Links
[1] For the exhibition on regenerative agriculture at Alyth Museum – the Living Field post: Farming Fit for the Future.
[2] The Living Field web has several times used Andrew Wight’s records of journeys around mainland Scotland’s farming regions, for example at The Mill at Atholl and Great quantities of Aquavitae. Wight, A. 1778-1784. Present State of Husbandry in Scotland. Exracted from Reports made to the Commissioners of the Annexed Estates, and published by their authority. Edinburgh: William Creesh. Vol I, Vol II, Vol III Part I, Vol III Part II, Vol IV part II, Volume IV Part II. All available online via Google Books. With thanks.
[4] The original map, from which Fig. 1 was derived, was constructed by Nora Quesada Pizarro and Graham Begg, working with Geoff Squire, at the James Hutton Institute, Dundee. The original was edited by the author to show approximate areas of managed arable and grass. The background data and the method of constructing this and similar maps by Hutton researchers, have been described on the Living Field web at Can we grown more vegetables. The map in Fig. 2 was constructed from grid coordinates for fields separated into broad categories of arable and grass.
Exhibition at Alyth Museum: Farming Fit for the Future. Regenerating soil. Balancing crops and livestock. Restoring biodiversity. Opening new supply chains. Lessons in the transition to sustainable food production.Cateran Ecomuseum and Bioregioning Tayside.
Farming Fit for the Future opened recently at the small local museum in Alyth, Perthshire [1]. The farms involved are each moving to regenerative and sustainable practices.
The Living Field attended the exhibition’s opening to discover more of the background from organisers of the Cateran Ecomuseum, to meet the farmers and learn about their regenerative methods.
Exhibition panels on a photograph of Strathmore, north from Dunsinnen, when a layer of cloud appeared to separate the green and brown of the lowland fields from the distant hills (photo by curvedflatlands.co.uk).
Why the need for regenerative farming? Agriculture endured a sustained depression beginning in the late 1800s – a period named the Forty Bleak Years, 1875-1914 [2]. The country could not feed itself when blockaded in 1914 and then again in 1939. Subsequent governments realised they had to end their centuries-old indifference to farming and food production.
The ensuing intensification of farming after the late 1950s achieved probably the greatest ever rise in output, but some of the technologies that increased yield also damaged soil and essential ecosystem processes and polluted the wider environment.
Today, many in farming and food see the need to repair the damage and set a more sustainable course, but only a small fraction of farms are converting. Examples are needed to show how it can be done and this is where the exhibition comes in.
Clare Cooper, a founder member of the Cateran Ecomuseum, explained how the idea of an exhibition arose out of talks between the Ecomuseum [3] and the Rapid Transition Alliance [4]. More on that below …. but first some notes on the farms and what they aim to achieve.
The farms and their transitions
The exhibition introduces the problems resulting from over-intensification, long supply chains and a disconnection between food, farming and people. It moves on to look at a varied group of farms, showing how each transitioned to regenerative agriculture and the resulting benefits.
Farms covered a range of sectors including mixed arable and livestock at Lindertis Farm and Barns of Airlie which also grows and processes hemp. There’s all-arable production at Easter Rattray Farm, pasture- and hill-grazed livestock at Kinclune Organic Livestock Farm, and three more organic farms producing varied output – South West Fullerton, East Mains Auchterhouse, and Myreside Organics. Inverquiech Farm is unusual in operating part of the land as a Permaculture system, where trees, shrubs and other perennial plants are mixed in the same space, as in a forest-garden.
A common theme was the pressing need to save, build and regenerate soil. To do this, farming needs to ensure that more organic matter, mainly from microorganisms, plants and invertbrates, is added to soil than lost from it by erosion through wind and water. Excessive loss occurs when certain factors dominate such as exposure of bare soil for long periods to solar heating, rain and wind, intrusive tillage that disrupts a soil’s cohesive networks, compaction by heavy machinery and repeated use of mineral fertiliser and pesticides.
Regenerative practices include (a) covering the ground with vegetation or mulch for as much of the year as possible, (b) replacing Intrusive, pre-sowing tillage with minimal cultivation such as direct drilling of seed, (c) raising organic matter (carbon) inputs to soil by growing perennial grass and crops, or carbon-building annual crops such as hemp, and (d) growing legumes as grains or forages that ‘fix’ nitrogen from the air into living plant matter which then turns to nitrogen-rich soil organic matter. Chemical pesticides are reduced, or not used at all as in organic farming.
Circularity, diversity and habitat
The Farms also aim for circularity – using materials from one part of the farm to benefit another, so reducing waste. For example, livestock is grazed in open fields (not in enclosures using imported feed) and the dung used as fertiliser. Most of the farms are also diversifying in terms of the range of crops and grass grown.
The regenerative practices support what researchers call Biodiversity for Agriculture or B for A – the mostly microscopic or just visible life forms that build soil, retain nutrients and give fields some resistance to hard weather and other external forces. In supporting B for A, the fields and farms also encourage the wider biodiversity in the landscape by providing food and shelter.
The organic farms report that their changed practices have brought a range of benefits. For example, the re-establihment of wet grassand at Kinclune Farm has encouraged endangered waders such as lapwing and curlew to return. South West Fullarton, Myreside Organics and East Mains Auchterhouse stress the wide-ranging benefits of their chemical-free approach for the land, the soil, the wider biodiversity and the quality of food they produce.
Origins
The exhibition stems from two innovative movements – the Cateran Ecomuseum [3] and Bioregioning Tayside [5]. Both are based in the catchment of the River Tay and its tributaries. Clare Cooper, a founder member of both gave the Living Field some background.
The Cateran Ecomuseum is unique in that its main presence is in the countryside, not primarily in a building. Here’s an extract from the Museum’s web: “In the short period of time since the creation of the first phase of the Ecomuseum and its launch in late 2019, global heating and biodiversity loss have continued to escalate and there is now worldwide recognition that widespread behaviour change to regenerative lifestyles is necessary if we are to live within planetary ecological boundaries.”
The Ecomuseum designed a three-year programme aimed at helping communities and visitors take rapid climate action and transition to more regenerative ways of living. The farming exhibition is part of this programme, and arose through links with the Rapid Transition Alliance [4], a network of international organisations engaged in practical work, research and campaigning to tackle the climate emergency. The Ecomuseum takes inspiration from the several thousand years of history during which the people of the region have repeatedly sustained their existence by changing their relationship with the land.
Bioregioning Tayside contributes through its programmes on local food production and short food chains. Clare writes: “By 2022, Bioregioning Tayside had started to think about the food theme and ran a learning journey [5] about food producers in Tayside which led me to start thinking about the transition that food producers needed to make in the light of the polycrisis.” Then continuing the theme, Bioregioning Tayside organised a well attended conference in March 2023 on Feeding Tayside through the Climate Crisis [6].
And going back to the Ecomuseum (Clare writes) … during 2022, we were also given access to the Alyth Museum and so I proposed and we fundraised for an exhibition about local food producers who were already making rapid transitions ……”
And this exhibition is the result …. But it’s more than a room lined with wall panels. Wider discussion on its main themes should influence others to begin the transition to regenerative agriculture.
Authors \ Contacts
Background to the Cateran Ecomuseum and origins of the exhibition provided by Clare Cooper (bioregioningtayside@gmail.com) and Ruth Watson (ruth@watsonconsultants.scot). Author/contact for this article geoff.squire@hutton.ac.uk or geoff.squire@outlook.com.
Ed. Many thanks to Clare Cooper and Ruth Watson for the background to the exhibition and Cateran Ecomuseum and for the invitation to the exhibition’s launch. Images on this page are photographs of wall panels taken at the exhibition’s opening.
Sources | links
[1] Farming Fit for the Future. For location, opening times, parking, etc. see Alyth Museum. The exhibition opened on Sunday 19 May 2024 with contributions from Clare Cooper, Pete Ianetta of the James Hutton Institute, Dundee and Jillian Kennedy of the Scottish Association of Young Farmers Clubs.
[2] Symon, JA. 1959. Scottish farming – past and present. Oliver and Boyd, Edinburgh and London. Chapter 7 titled Forty Bleak Years : 1875 – 1914 covers the period of the agricultural depression from the severe weather of the late 1870s to the beginning of conflict in Europe. Governments relegated home farming in preference for food imports from north America, causing mass rural depopulation and the loss of much arable cropland and ploughed area. Though the author asserts at the end of the chapter that ‘The industry had suffered grievous hurt but had survived and by 1914 it was in a reasonably sound condition.’ he goes on to describe in Chapter 9, the period between the wars in these terms: “The policy of setting cheap imported food and high profit above the needs and security of a continuing society had created a feeling of profound depression in the (farming) industry.”
[4] The Rapid Transition Alliance is….. ‘a network of international organisations that are engaged in practical work, research and campaigning to tackle the climate emergency. We are united by the belief that we must act urgently to maintain a habitable climate and that our action must be at a speed and scale to match the challenge.’ More backgound at Museum of Rapid Transition: museums in a world facing existentiol crisis by Andrew Simms, 30 April 2019.
[6] Feeding Tayside through the Climate Crisis: Launch Conference and Future Plans.’On March 24th (2023), at Discovery Point in Dundee, a group of around 100 people from across Tayside and beyond met to discuss the crucial issue of how we feed our communities through the climate crisis.’
Australia. Wild plants. Indigenous knowledge. The Living Pavilion at Melbourne University 2019. The book ‘Plants – past present and future’. Plant blindness – our loss.
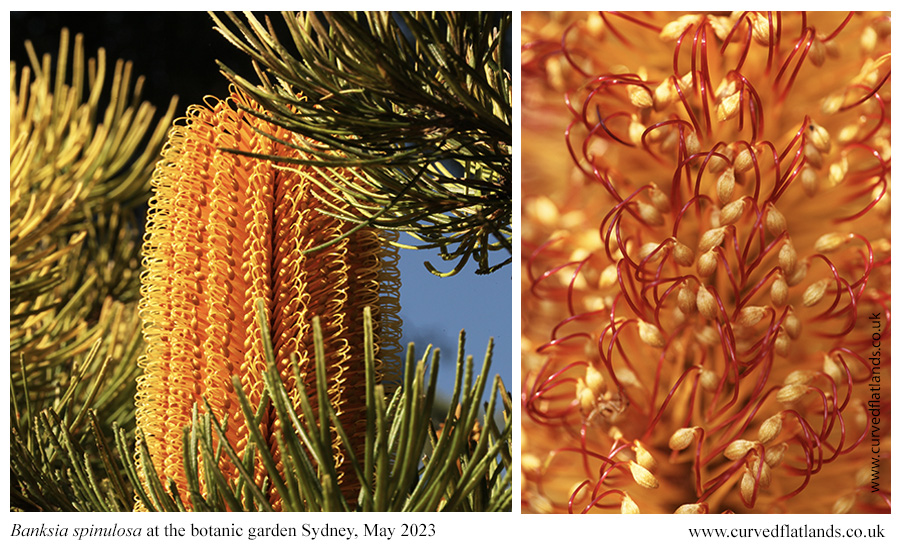
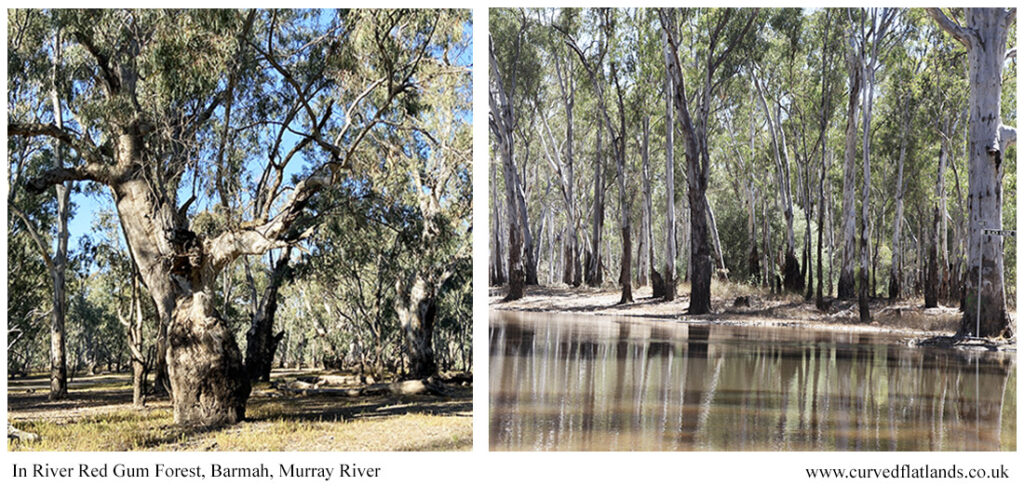
Recent travels [1] to see again the River Red Gums, Boxes and Ironbarks and all the other plants around the Murray River in Australia, led first to the Botanic Garden in Sydney [2] where among hundreds of species grew the grass tree Xanthorrhoea, famous for its gum but having many other uses, and the hairpin banksia Banksia spinulosa in full flower.
This Banksia, native to eastern coasts, was given its Latin name after botanist Josef Banks, who travelled with James Cook in the late 1760s, but the continent’s many Banksia’s – like many other Australian plants – had been known, named and used for tens of thousands of years before then.
Which thoughts were present on seeing a series of books on Indigenous knowledge [3] at the Garden’s shop. And reading one named Plants – past, present and future [4] was a revelation.
Plants by Cumpston, Fletcher and Head (2022) introduces many of the species that have sustained people in Australia, and makes the case for returning to these well-adapted forms as climate, habitat loss and soil degradation expose the limitations of some current agricultural practices. That’s for another article ….. but finding more about Plants led to the web presence and reports on Melbourne University’s Living Pavilion.
Living Pavilion 2019
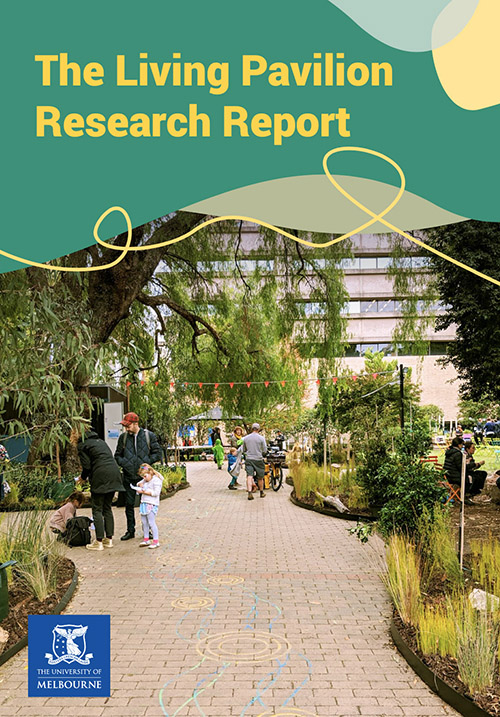
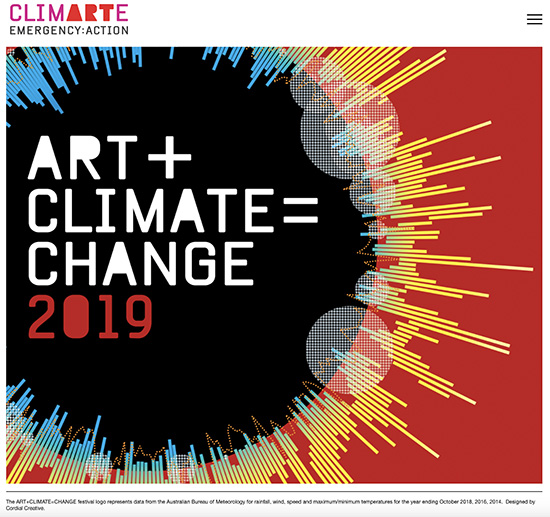
The Living Pavilion [5] was an exhibition and centre of learning built in 2019 as a space, primarily occupied of plants, in which people could walk, see, touch, smell and wonder. It was part of CLIMARTE’s ‘ART+CLIMATE=CHANGE’ festival, 1-17 May 2019 [6]. Here’s an extract from page 9 of the the Living Pavilion report [5]:
“The landscape design transformed a seemingly unspectacular part of the campus into a haven of biodiversity and Indigenous stories through the installation of over 40,000 Kulin Nation plants, artworks, gathering spaces and soundscapes. It brought together Indigenous knowledge systems, community arts, performance, music, sustainable design and ecological science to showcase how transdisciplinary initiatives can sow the seeds of community vitalisation and environmental stewardship.”
The plants were the central feature of the Pavilion, assembled in a way that people could walk and sit among them, see, touch and smell them. Descriptive signage explained how Indigenous communities cultured plants in agriculture and aquaculture and derived many useful products from them [7]. A range of edible and medicinal plants, grown in an Indigenous Community Garden, taught the value of plants not only to people but to the wider ecosystem, including insects and other invertebrates.
For amphibian lovers, there was the Frog Fest including the Frog Soundscape which produced calls from a range of frog species in a re-creation of a waterway – the Bouverie Creek – which the university built over but which continues to flow beneath it. And there was more at the Frog Fest in the way of activities for children, like dressing as frogs, face painting and making frog life-stages in clay.
Art, craft, song and dance
Art and music was inseparable from the plants and their uses. Spaces were allocated to craftwork, singing, dance, art installations, demonstrations and soundscapes.
Artists and craftworkers taught the utility of native plants using traditional techniques. Stephanie Beaupark showed how fibres and dyes from native plants are used in weaving; while Katie West recreated a fishing net using materials and methods that few now know about [8].
Song and dance enlivened the festival, including performances from the Djirri Djirri Dance Group, The Orbweavers and The Merindas. You can get a feel for what it must have been like by visiting the performers’ web sites [8].
What resonates with the Living here is the belief that human society and culture are “an inherent and inseparable part of ecosystems”. The Living Pavilion’s logo, which can be seen on the web page is described: “The circle in the middle represents a meeting space. The water represents the creek that once flowed through the space and signifies journey and life. The plants represent flora and fauna and connection to Country and place.”
The Living Pavilion was the seventh in a series of events under the collective name The Living Stage developed during a PhD at Melbourne University by Tanja Beer. This bringing-together of people and culture with ecosystems and artistic performance continues through the project Ecoscenography – adventures in a new paradigm for performance making [9].
First knowledges book series
The book referred to above, Plants – Past, Present and Future by Zena Cumpston, Michael-Shawn Fletcher and Lesley Head, is one in a series titled First Knowledges edited by Margo Neale [3].
Another in the series is on land use and management, titled Future Fire, Future Farming by Bill Gammage and Bruce Pascoe. Here’s an extract from the publisher’s web: (the authors) ‘demonstrate how Aboriginal people cultivated the land through manipulation of water flows, vegetation and firestick practice. Not solely hunters and gatherers, the First Australians also farmed and stored food.’
An important theme in these books is that agriculture began tens of thousands of years before modern wheat, rice, maize and the other main cereals were domesticated from wild grasses. Similarly, systematic methods of land management were in place, for example to reduce the ‘killer fires’ that have caused so much destruction in recent years.
Lessons for the Atlantic zone croplands
There is much for us to learn from these books. Little is known of plants and land use in northern Britain and Ireland before to the retreat of the last ice 10,000-12,000 years ago. Modern crops have been grown here for only half that time, but before their arrival, and until recent centuries, people used wild plants for food, medicine, dyes, clothing and building.
Knowledge has been retained in written records, including accounts originating during the monastic expansion from Europe [10] and in more recent herbals [11].
Yet while some specialists are re-learning and extending plant knowledge today, the broader existence and utility of plants is unknown to most people [12]. It’s not just the knowledge that is fading – the plants themselves have also been made rare or extinguished. The recent Plant Atlas 2020 by the Botanical Society of Britain and Ireland [13] shows loss and extinction are continuing.
One of the main aims of the Living Field has been to show people the wealth of plant life in our region, especially the older crop species and varieties that are no longer grown and the many native plants and long-term introductions that have been used in various ways since the retreat of the ice. We will continue with that work.
The Living Field here could also learn from the Living Pavilion in Melbourne. We could bring in far more plant species and varieties for people to learn about. We could restore forgotten uses of our native and introduced species and link them to our cultures and places. And perhaps more than anything, we can feel we are not alone in the restoration of our botanical diversity – people throughout the world are doing the same.
There are organisations in the UK to help if you want to know more about plants and get involved in their conservation [14]
Sources | links
[1] The editor writes of a visit in March 2023 to Australia.
[3] First Knowledges series edited by Margo Neal. For details on all books in the series: Thames and Hudson Australia web site.
[4] Cumpston Z, Fletcher, M-S, Head L. (2022) Plants – past, present and future. Thames and Hudson Australia, 212 pages.
[5] Living Pavilion at the Clean Air and Urban Landscapes Hub where a substantial report on the project can be downloaded (cover shown above). Citation: Beer, T., Hernandez-Santin, C., Cumpston, Z., Khan, R., Mata, L., Parris, K., Renowden, C., Iampolski, R., Hes, D. and Vogel, B. (2019). The Living Pavilion Research Report. The University of Melbourne, Victoria, Australia.
The web link left describes how this image is made from weather data.
[6] CLIMARTE an Australian charity founded 2010 ’harnesses the creative power of the arts to inform, engage, and inspire action on the climate crisis’. Web site: https://climarte.org/ The group’s ART+CLIMATE=CHANGE 2019 Festival ‘presented 33 socially engaged exhibitions and events … across Melbourne and regional Victoria’. The Living Pavilion was one of them. Festival web site: climarte.org/project/artclimatechange-2019 where there are links to the full programme, podcasts and other resources.
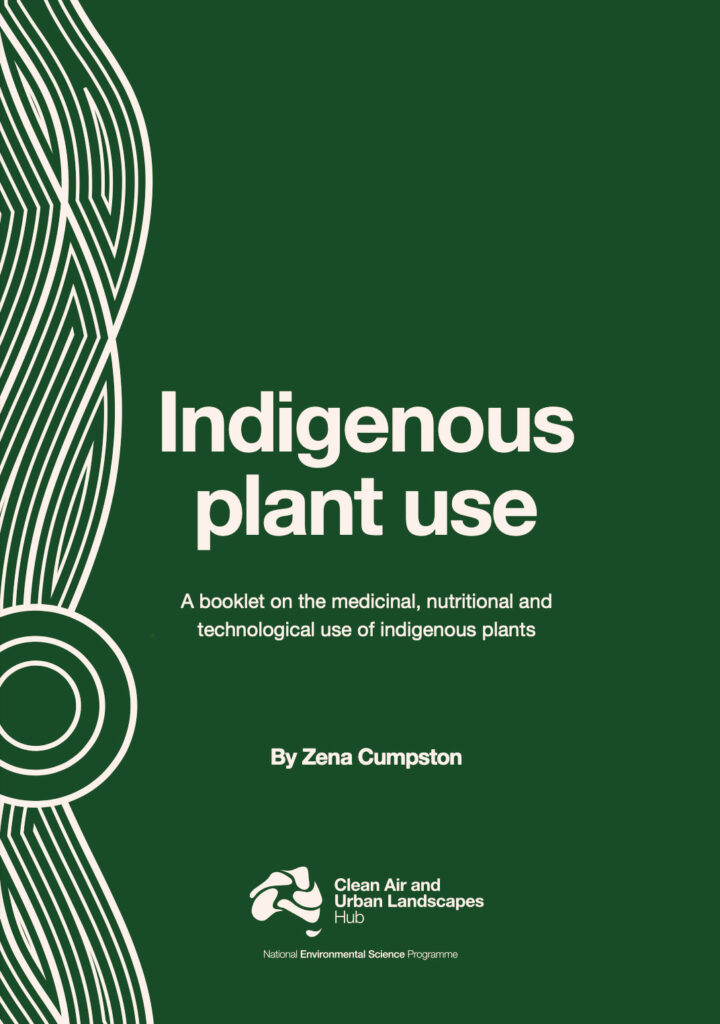
[7] Cumpston, Z. (2020). Indigenous plant use: A booklet on the medicinal, nutritional and technological use of indigenous plants. Downloadable at Living Pavilion web page at Clean Air and Urban Landscapes Hub [cover shown right, see also 5].
[8] Performing at the Living Pavilion 2019 – some current web links : artists in residence Stephanie Beaupark and Katie West || Singing and dancing from Djirri Djirri – Wurundjeri Women’s Dance group || The Orbweavers – their song Reeds Rush links several features of the Living Pavilion || and The Merindas.
[9] Ecoscenography by Tanja Beer: blog, reading group, articles and artworks, ecological design for performance.
[11] Modern herbals and books and plant lore are listed at the end of the Living Field’s Garden/Medicinals page.
[12] Plant Blindness – a human inability to see plants, differentiate between them, understand what they do, accept them as the basis of animal and human life. More at Wikipediaincluding pointers to research and teaching material e.g., Wandersee, J. H., & Schussler, E. E. (1999). Preventing plant blindness. The American Biology Teacher, 61, 82–86.
[13] The recently published Plant Atlas 2020 by the Botanical Society of Britain and Ireland details the serious declines in native plants and plants introduced in the distant past, contrasting with the spread of recent introductions. See the Living Field’s notes on the latest and previous atlases at BSBI Plant Atlas 2020.
[14] Want to get involved with plants? In the UK, find out more through the Botanical Society of Britain and Ireland and Plantlife – both organisations promote plants through learning, training, meetings and visits, and welcome plant enthusiasts from absolute beginners to experts.
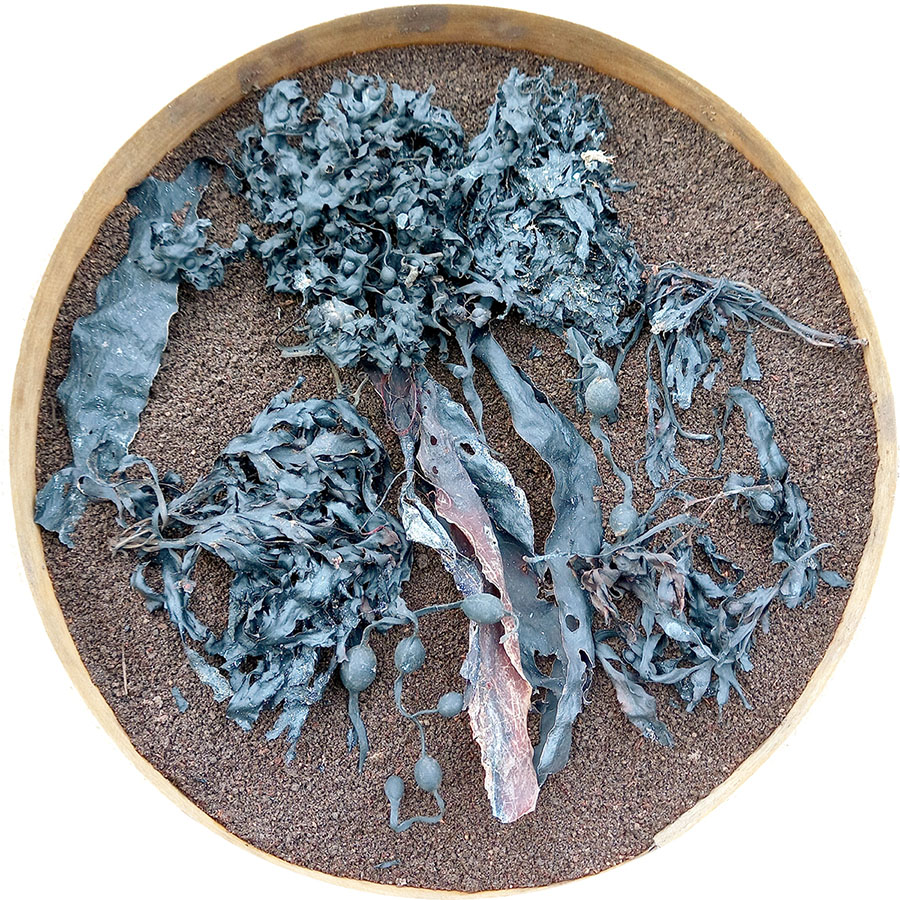
If you are in Cahors, Occitane this month, you should not miss this exhibition Nature Under Screen – Nature au crible – by Pascal Levaillant and Roselyne Corblyn, hosted by Cahors Juin Jardins [1] and held 1 to 31 March [2].
If not, then here are some of their works – see more via the links below.
Pascal and Roselyne are artists-botanists who form the Leveillant-Corblin collective [3].
Seminotheque graines du Quercy, 2024 Cahors
From the press release … “Cahors Juin Jardins welcomes the Norman duo Corblin-Levaillant (aka Roselyne Corblin and Pascal Levaillant) for an installation of contemporary herbaria which announce Spring already! Based on the annual theme of June Gardens Humus Miraculum, the duo of artists deploys all their botanical knowledge starting from humus, a miracle substance, down to the seed, exploring biodiversity in France for over a decade.”
“Both botanical artists stopover in Cahors, nourishing their exhibition with literary references and botanical (Gaspard Koenig; Marc-André Selosse, Patricia Touyre, Anne Cauquelin…) and offering several artistic and botanical pieces with poetic names (Botanical surveys, Compost escapes, Seminotheque outings…) to pay homage to the miracle of humus. To be discovered in the hall and the garden of the Chai.”
[2] Press Release: JUNE GARDENS EXHIBITION | NATURE UNDER SCREEN Shades of humus and botanical leavening. Corblin-Levaillant collective, visual artists-botanists, LE CHAI (youth hostel – 52, avenue André-Breton in Cahors) From March 1 to 31, 2024 from 10 a.m. to 12 p.m. > 2 p.m. to 6 p.m.
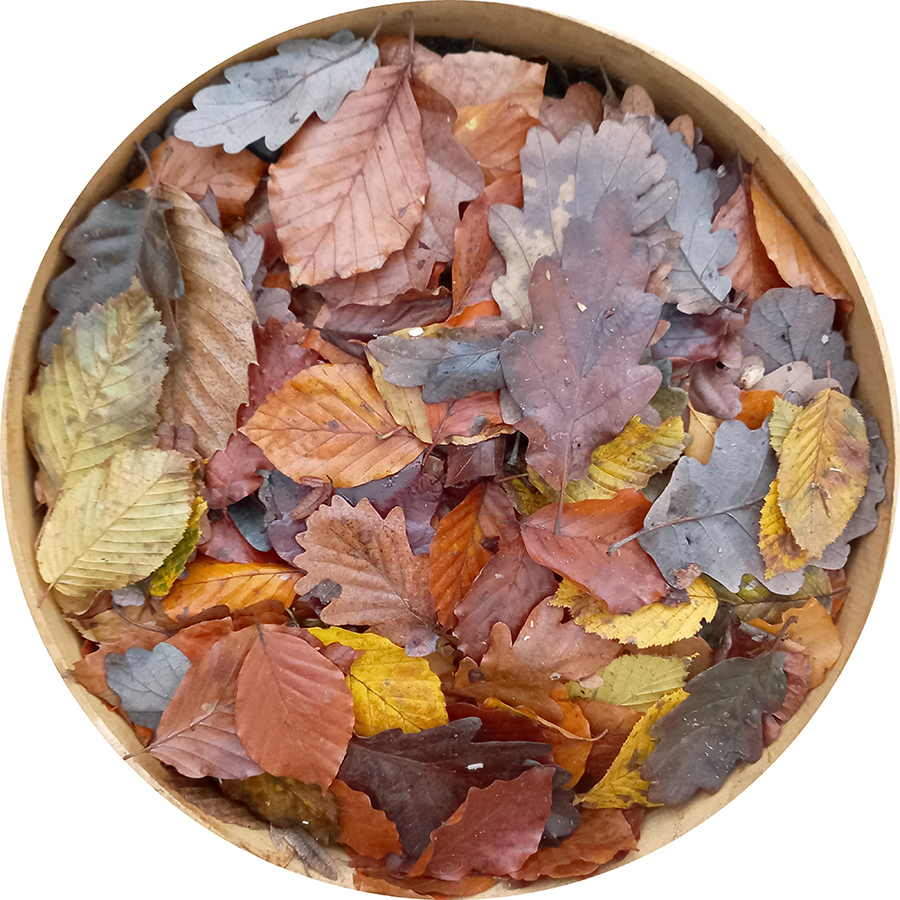
Litiere forestieres feuilles chene hetre charme Foret de Roumare 2023
Ed: many thanks to Pacal and Roselyne for sharing details of their exhibition in Cahors and sending the images shown on this page. Here’s to Humus miraculum, and all things botanical!