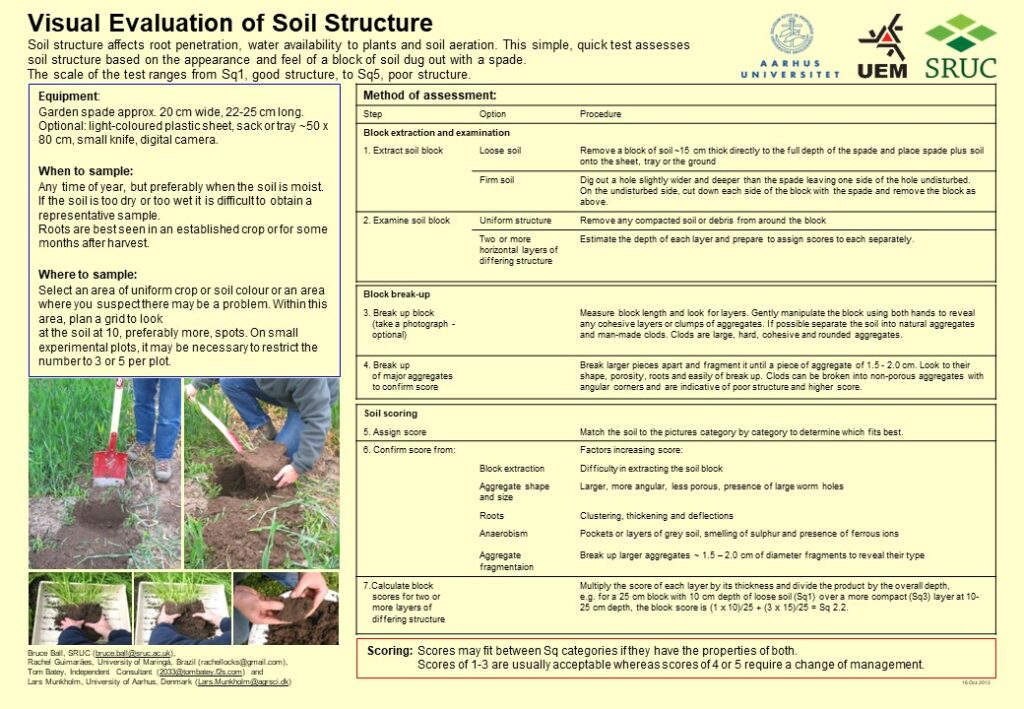
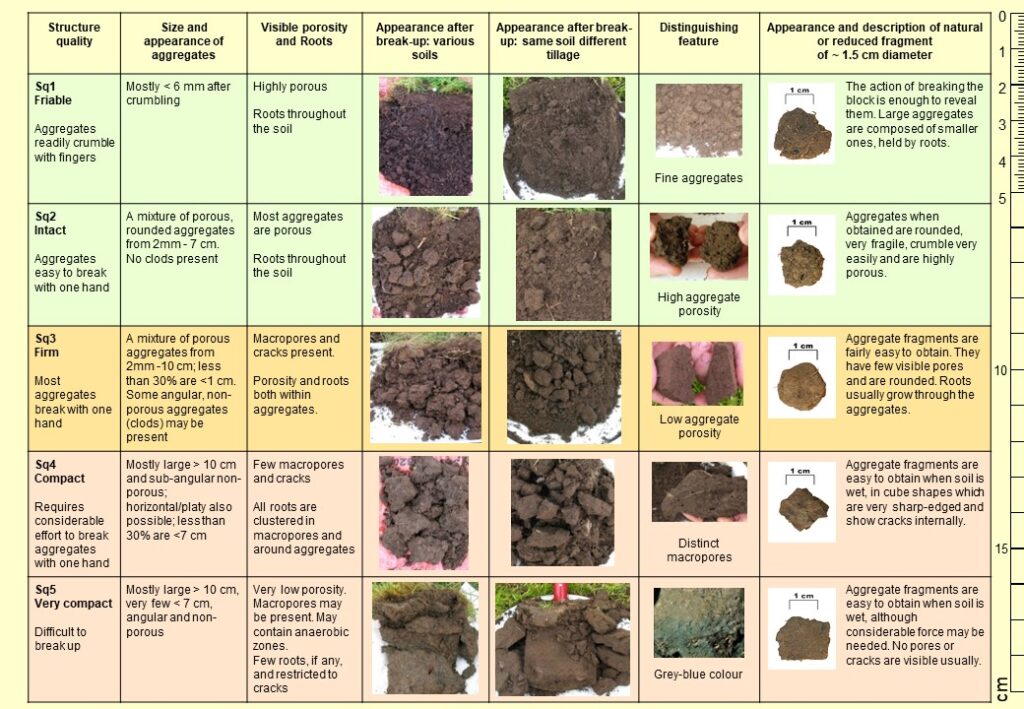
Back in 2007, soil scientist Bruce Ball and his collaborators published a research paper on VESS – Visual Evaluation of Soil Structure [1] – and released a two page summary of the methods for anyone to use, free of any charge. The two-pager was printed on the back and front of quality paper, which was then laminated to form a durable sheet that could be taken out to the field as a guide and reference to quickly estimate soil health.
Recently, the Living Field editor was working with people creating an exhibition on regenerative farming to be held later in 2024 at a museum in the Tay Catchment. Questions around good and bad soils came up – was it possible to tell the difference between them without laboratory analysis, and were photographic guides available to illustrate soil quality for visitors to the exhibition?
VESS came to mind, since, as is evident from the reproduction below, it depicts soils of different quality. And Bruce was the obvious person to contact for guidance and photographs.
Plate 1. The two-page VESS guide to soil structure [1].
VESS is an example of scientific research condensing a great deal of technical information into an easy-to-use practical guide. Intended users were agronomists and farmers, and indeed anyone who wanted to learn a bit more about agricultural or garden soil.
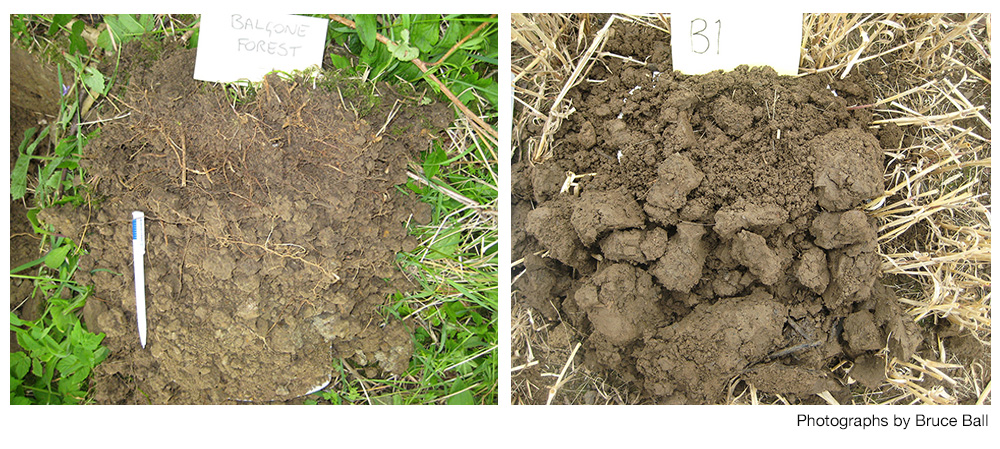
Here are two contrasting images of the same medium-textured soil. One under woodland (left) has very good soil structure with many roots. The other under cereal cropping nearby (right) contains compacted clods below a fairly good structured surface layer. The VESS guide indicates for each soil the likely degree of pore space through which roots could penetrate the medium to extract nutrients and water.
Plate 2. Two soils ready for Visual Evaluation, left from a woodland, right from a cereal field.
Since its initial publication, VESS has travelled to other parts of the world, including the Amazon Basin [2]. It is being adapted and trialled for new soils and regions, contributing to our understanding of global soil health.
New Book : Healing soil
Continuing his aim to bring the world of soils to non-scientists, Bruce has recently (2022) published a book titled Healing Soil – How soil health will save the planet and us [3]. The author writes:
“This book is a journey that explores the importance of our soil to our world and humanity and the connection that can be found between soil and both of these. Each of the three parts of the book contains a series of short illustrated items spotlighting a key way that soil contributes to the health of ourselves, our society and our planet. The items are illustrated either by artworks that I have created or by photographs to show the interplay between the fate of the soil and the fate of our world – from all of humanity down to the way we live our individual lives.”
Below are two examples of Bruce’s illustrations in the book.
Soil greening power. Acrylic on board. The seed in the centre produces its seedling by the greening power of soil fertility thrusting from below.
References | links
[1] Ball BC, Batey T, Munkholm LJ (2007) Field assessment of soil structural quality – a development of the Peerlkamp test. Soil Use and Management 23, 329-337.
[2] Rachel M.L. Guimarães, Afrânio F. Neves Junior, Wellington G. Silva, Craig D. Rogers, Bruce C. Ball, Célia R. Montes, Bruno F.F. Pereira. (2017) The merits of the Visual Evaluation of Soil Structure method (VESS) for assessing soil physical quality in the remote, undeveloped regions of the Amazon basin. Soil and Tillage Research 173, 75-82, https://doi.org/10.1016/j.still.2016.10.014
[3] Ball BC (2022) Healing soil – how soil health will save the planet and us. Published by Bruce Ball, Roslin, Midlothian, UK and distributed by Kindle Direct Publishing Services, Amazon, Seattle, Washington, USA. Ed: search ‘author’ and ‘title’ to find web sites for online purchase.
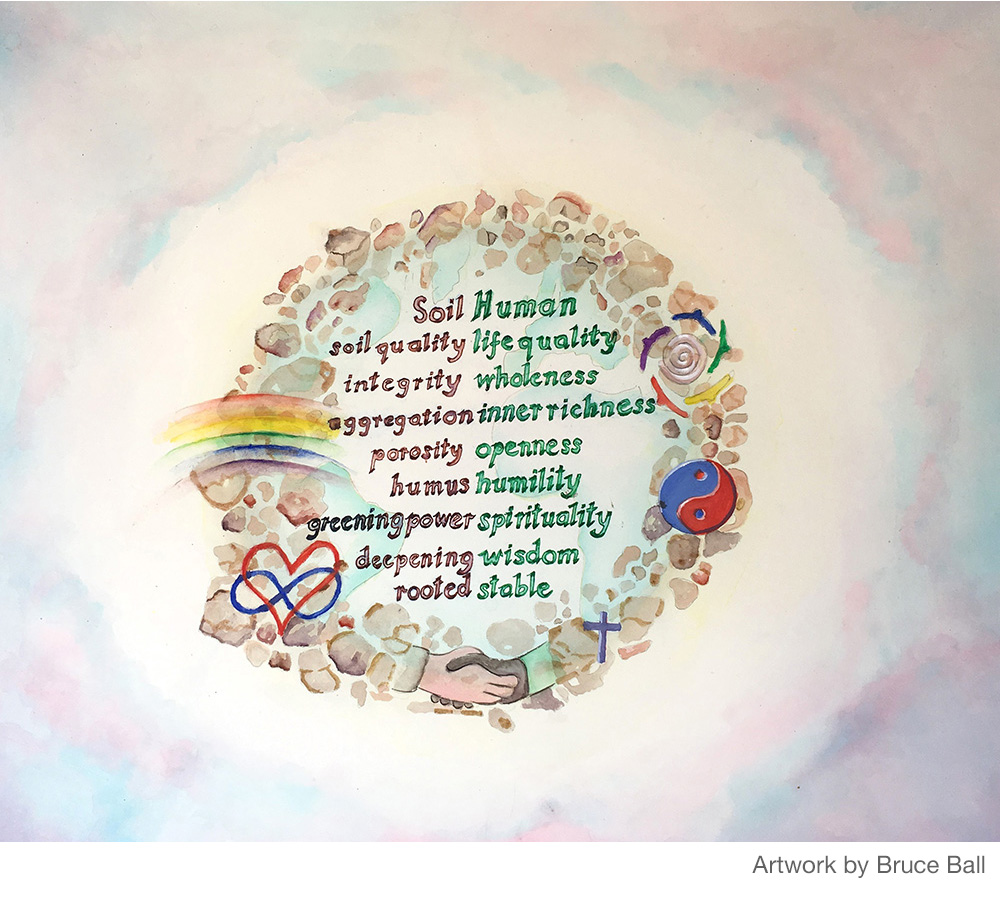
A World of Soil for Healing People and Planet Earth. Mixed media on paper. In the same way that soil encircles the World, when humans nurture soil-like properties they can work in unity to sustain life on Earth.
Contact
Email : bruceball62@gmail.com
Ed: many thanks to Bruce for sharing his knowledge of soils. His book [3] contains many striking illustrations that link this thin, life-sustaining layer to the future of all people.
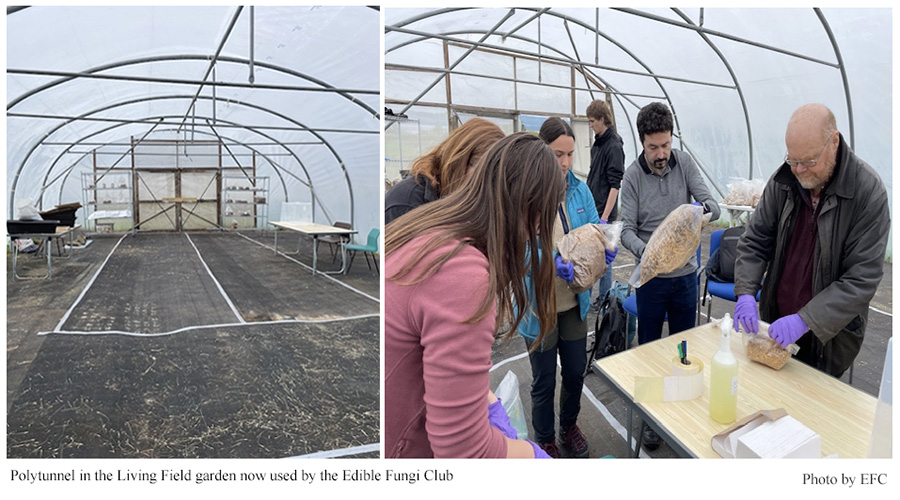
The Edible Fungi Club (EFC) was formed in March 2022 by Gill Banks “who has a keen interest in mycology, be it recording fungi in the Tayside and Fife area through forays with the Tayside and Fife Fungi Group (TAFFG) or growing edible varieties”.
Gill writes: “I asked some people within agroecology if they would join such a group and was encouraged to see that people were interested. Because of this, senior management at the James Hutton Institute were approached and asked if it was possible to hold meetings for a club in the Living Field polytunnel, which at that time was unused. After consultation with various people at the Institute such as Hutton’s Health and Safety and Plant Health officer, and some form filling, the club had an area in which to meet.”
Edible | Exotic | Gourmet
The aim of the EFC is to provide “edible exotic and gourmet mushrooms” to people who may not have access to them (such as Lion’s mane which is a red listed protected species in the UK) and to encourage people to recycle some waste products such as cardboard and coffee grounds. The club also wishes to explore other uses of fungi such as making clothes, packaging, myco-remediation and eventually medicinal aspects.
The Institute’s Social Club kindly donated £100 to help start up, the farm staff gave bales of straw and an Aberdeenshire farmer donated 75 kg of spring barley that is used to produce grain spawn (see below).
The club charges £2 a session to cover costs of items such as wood pellets, mushroom bags, and liquid cultures, syringes, needles and so on that are required to successfully grow predominantly straw- and wood-loving mushrooms such as: Pink Oyster, Yellow Oyster, Summer Oyster, Blue/grey Oyster, King Oyster, Lions Mane, Black Pearl (a blue/grey Oyster and King Oyster hybrid) amongst others. The club can produce liquid mycelium, grain spawn (see photos below) and provide mushroom kits/substrates at a much-reduced price if members want to grow mushrooms in their home.
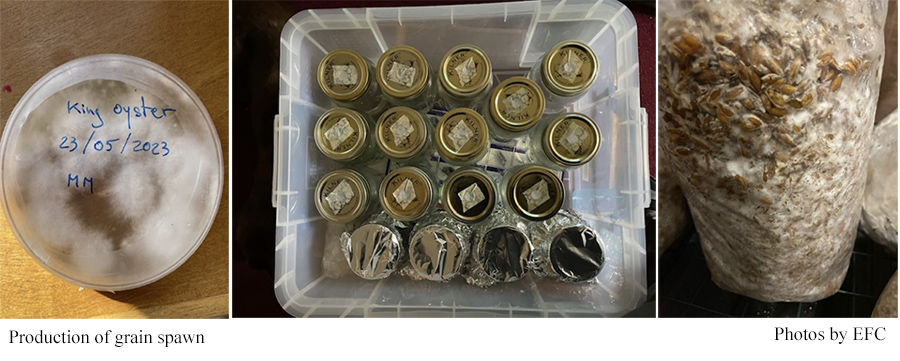
Grain spawn
Grain spawn is easy to use and an inexpensive method to bulk up mycelium. The process begins in a petri dish or liquid culture and can take several weeks to months depending upon the mushroom that is being grown.
In the photographs below, from left to right, we can see a petri dish with king oyster mycelium, liquid culture, and grain spawn.
The mycelium is the root-like, vegetative body of a mushroom that can be obtained in several ways, including from tissue culture, liquid culture, or spores. Liquid culture is a nutrient-rich solution that contains the mycelium and is used as a medium for growing and propagating mushroom cultures.
The mycelium when suspended in a nutrient solution, will grow, and is then used to inoculate substrate (in this case barley grain) to provide grain spawn. which will then be transferred to a medium that contains all the necessary nutrition to allow the mycelium to grow further. Eventually, the mycelium will fruit as shown in the photographs below.
Growing interest
The numbers of participants had originally been capped at 10 so that the club would have plenty of resources for its members. There are now 24 members with regular enquiries from people who wish to come along. All are welcome and our members come from within the James Hutton Institute community but also include members of the public who have heard about the club, usually by word of mouth.
Here are some of the results!
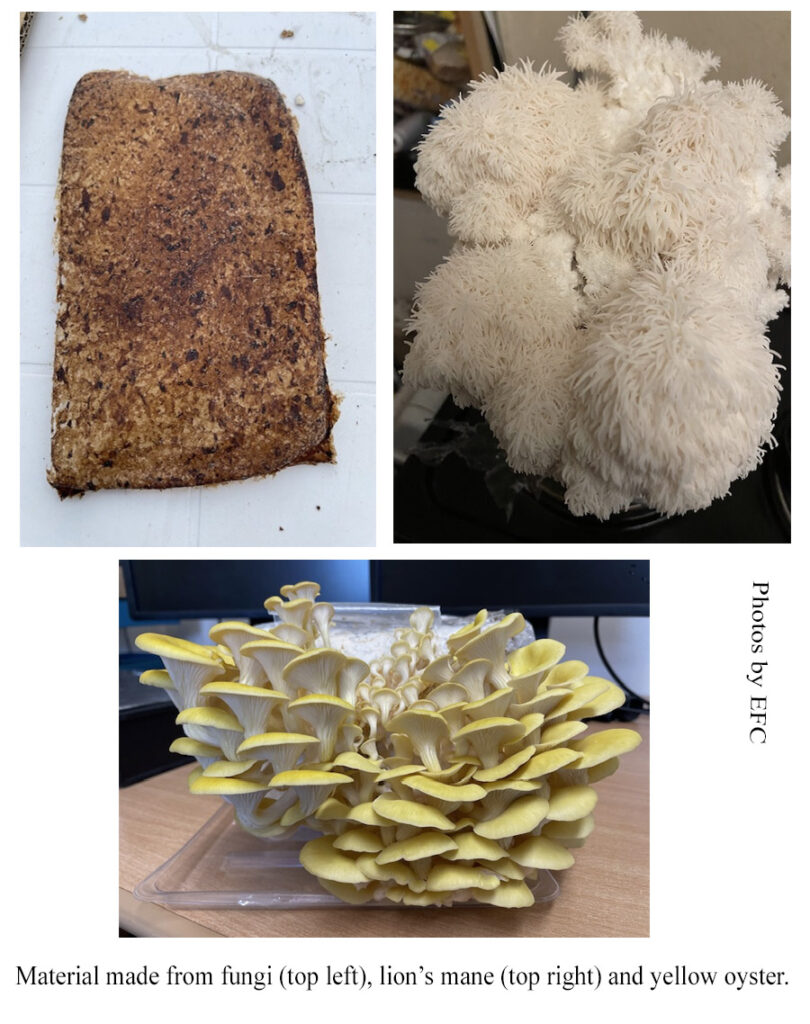
Mushroom paper
The material in the top left picture above is a version of paper made from Dryad’s saddle (Cerioporus squamosus) a basidiomycete bracket fungus also known as pheasant’s back and considered a good edible especially when it is young. This is one of the mushrooms that the EFC hope to grow in the future as it thrives on dead or dying wood. The cell walls of mushrooms are made from a biological polymer called chitin which is similar to cellulose from which plant paper can be made, so we thought that it would be an interesting thing to do.
Dyrad’s saddle proved a good candidate for paper making as it has strong fibres. The Dryad’s saddle was cut into pieces and put in a blender with a small amount of water and then blended until the mushroom became a pulp. We poured the slurry into a wooden frame with mesh underneath and let the water drain out, and then used paper towels to absorb excess moisture. Different mushrooms produce different coloured paper of differing strengths.
Food and medicinal
The second picture (next to the mushroom paper) is Lion’s mane (Hericium erinaceus), which has a long history of use in East Asian medicine. We grow it using hard wood fuel pellets and some soy hulls (to provide extra nutrition). In the UK lion’s mane is protected under Schedule 8 of the Wildlife and Countryside Act 1981, but it is an easy mushroom to grow as it has aggressive mycelium. Its health benefits are believed to support mental health, the immune system, brain function and stress responses. In addition, they have been reported to help people get to sleep. Depending on conditions, this mushroom can take from 3-5 weeks from grain spawn to fruit (produce mushrooms). It is a mushroom that does not taste like the average supermarket mushroom. It has a mild, sweet, taste with a firm and meaty texture.
Cooking mushrooms
The best way we find to cook mushrooms is…. Simply. We usually start off with a high heat to remove excess moisture, then lower the temperature, add some olive oil and/or butter with salt and pepper and fry. With any new mushroom it is best just to try a little amount first as some people may have some undesirable reactions which are usually due to the chitin content of the mushrooms.
The taste can change with length of cooking. For example, the third picture in the group above is of yellow oyster mushrooms (Pleurotus citrinopileatus), otherwise known as the golden oyster mushroom. This is a fast-growing mushroom with lots of fruits, and as it is a warm-weather strain, it isn’t found in the UK. This strain of oyster mushroom can be grown on a wide range of materials from supplemented sawdust, straw, coffee grounds and/or cardboard.
These mushrooms lose the yellow colour when they are cooked. If they are undercooked, they taste bitter, but if they are cooked for the correct amount of time, they have a balanced “nutty” flavour. If they are cooked until they are crispy then they can taste a bit like bacon. This species can produce mushrooms from grain spawn in as little as a week if the conditions are correct.
Author | contact
Gill has been approached to do a podcast, a talk at Dundee University and asked if she was interested in writing a book. Who would have thought so much could happen in under a year? It just shows that in this case the world is indeed your oyster (mushroom!).
Gill Banks (PhD) is a researcher based in the Agroecology group at the James Hutton Institute, Dundee. The polytunnel lies in the west side of the Living Field garden sited on the Hutton’s Mylnefield Farm.
Contact: Gill.Banks@hutton.ac.uk
Ed: thanks to Gill for this note on the Edible Fungi Club – it’s good to see the Living Field polytunnel in use again.
[Published 14 January 2024 – minor editing possible over the next few days]
Ad Gefrin museum and distillery in Wooler, opened March 2023. Life in the Northumbrian kingdoms 6th and 7th centuries. The nearby archaeological site of Yeavering. Importance of soil to archaeological insight. Fine example of local heritage and enterprise combined.
One of an occasional series on museums and botanic gardens.
It is always heartening (the editor writes) to find a local museum established and thriving. The Ad Gefrin museum and distillery at Wooler [1] in Northumberland, together with the archaeological site of Yeavering [2] are a fine example of what can be achieved away from the main centres. Yeavering takes its name from the Celtic Gefrin – the Hill of the Goats, so Ad Gefrin is By the Hill of the Goats [3]. The archaeological site lies several miles north of Wooler.
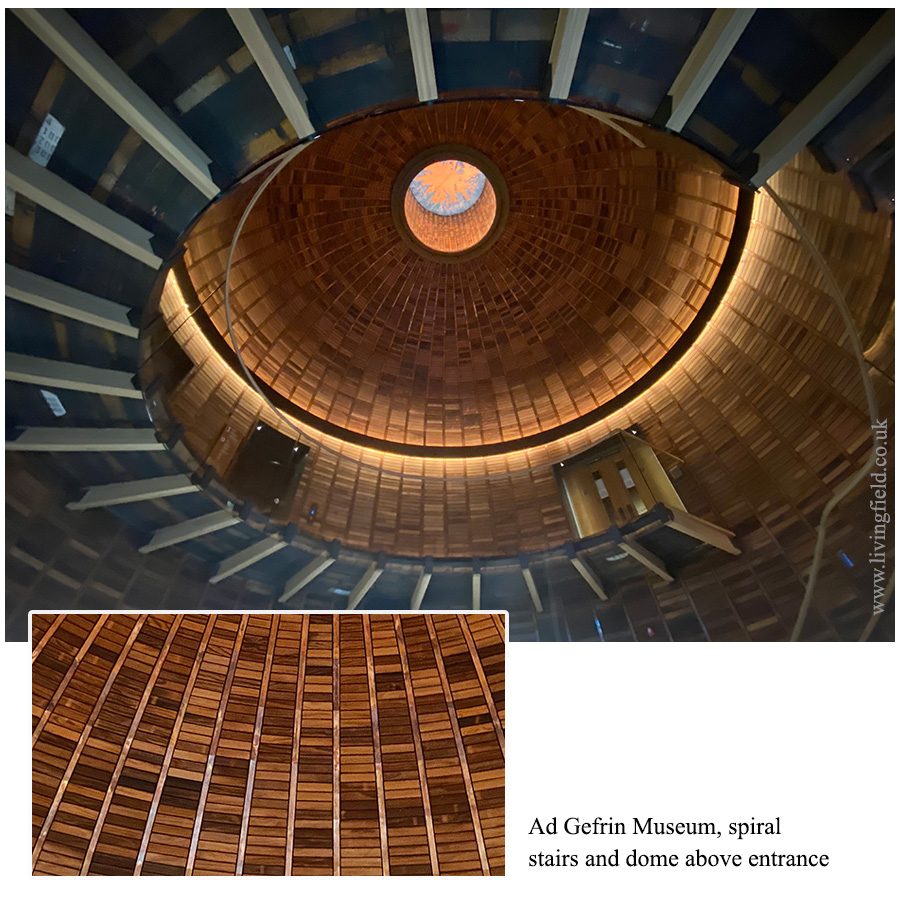
The museum and distillery opened in March 2023. Go through glass doors and immediately the stunning dome of the entrance hall rises above. It was made in the shape of a whisky barrel. The dome is lined by many small, rectangular pieces of pine, sourced from wind-blown timber, each piece prepared and fixed in place by a local craftsman.
The Great Hall
The museum aims to entertain and educate on the Anglo-Saxon, Northumbrian dynasty that governed the region in the 6th and 7th centuries. They established Yeavering from their main base on the coast at Bamburgh. By 700, the site had been deserted, its precise location unknown until rediscovered in the mid-1900s.
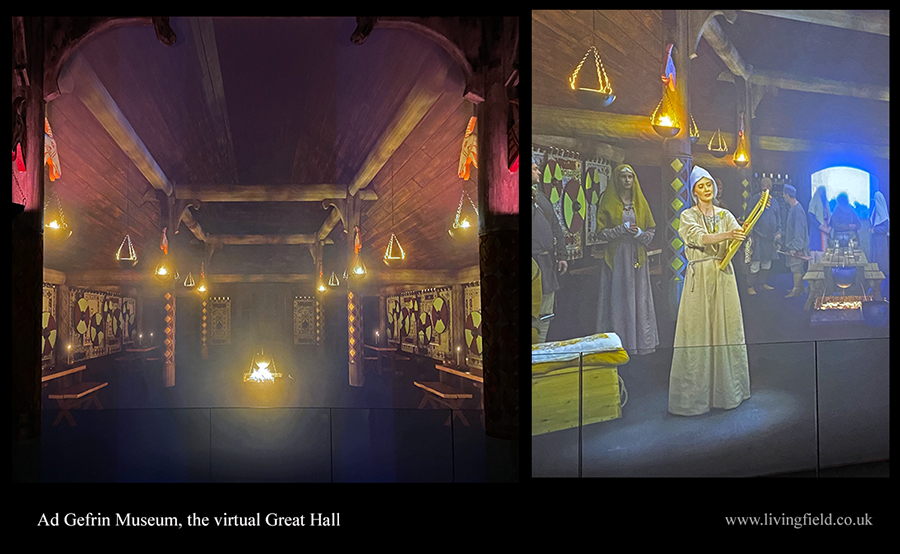
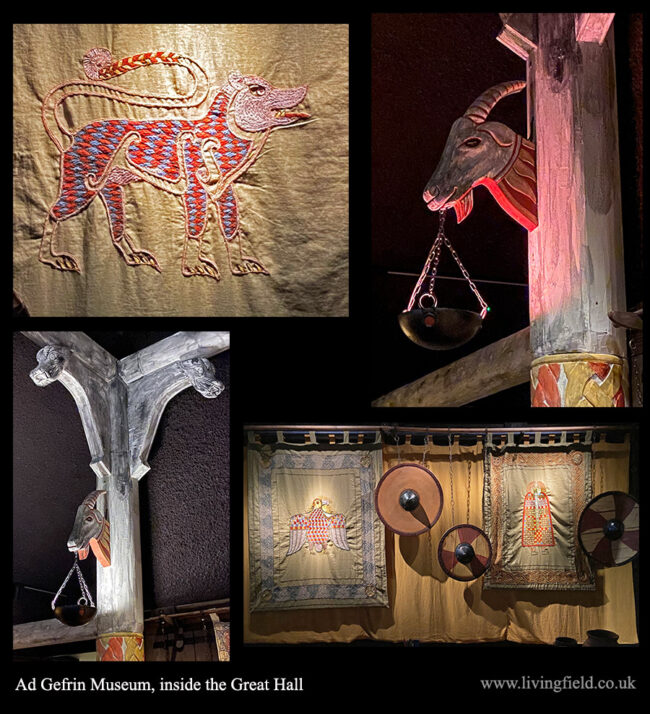
The museum reproduces a central feature of the Yeavering site – a building called the Great Hall. From the museum’s entrance, a spiral stairway (visible in the photograph above) leads to a door into the replica. Visitors can walk around one half of the hall, its walls covered in tapestries and carvings, some shown on this page. The other half is virtual, viewed through a screen and letting the viewer appreciate the full length and interior design of the building.
Linger for a few minutes and the virtual half comes alive as people appear, tell stories and sing of the kings and the life at that time. It’s an ingenious way of drawing peope in, making them feel almost as if they were there.
The museum displays some of the objects found during archaeological digs at Yeavering and models of some of the buildings including the Great Hall and a tiered Grandstand.
View from the real to the virtual half of the Hall (left) where actors and singers (right) tell stories of the life at the times of the Northumbrian kingdoms.
Yeavering archaeological site
The site was revealed through examination of crop marks on an aerial survey of the region in the dry summer of 1949. It was first excavated from 1953 to 1962 and the results published 1977 in an authoritative report by Brian Hope-Taylor, available today as a free download [4]. The report and its author have been widely praised [5]. It remains an engaging and impressive read, and not only for archaeologists. Enquirers from any discipline will appreciate the logical approach and the analysis of uncertainty in reaching conclusions from limited data, especially on the structure and functioning of different buildings and enclosures. The report repeatedly stresses the importance of soil to archaeological method (see below).
The site lies on an area of flattish land, known as the whaleback, the northern side descending steeply to the River Glen and the southern rising to the hills of Yeavering Bell. The River Glen joins the River Till which then feeds into the Tweed. Much evidence of occupation and farming since the neolithic have been found in this area. A large Iron Age hill ‘fort’ and many dwellings were built at the top of Yeavering Bell and the lower land around the Rivers Glen, Till and Tweed is dense with pre-historic settlement and signs of farming.
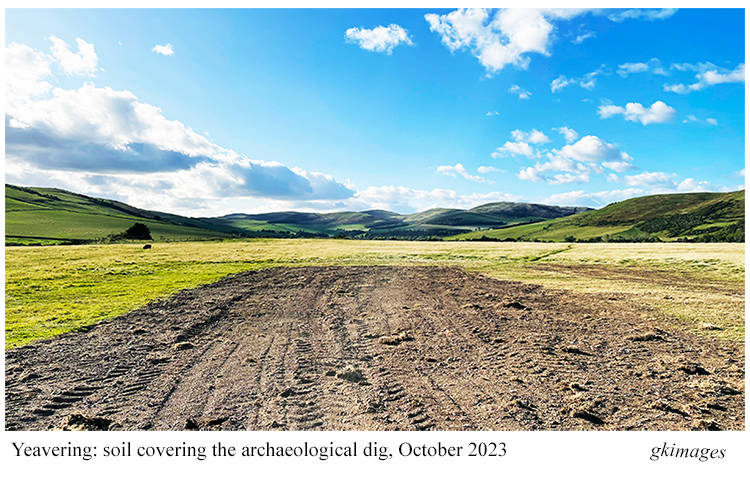
Archaeological studies at the site have continued and were active in summer 2023, but by October the exposed surface had been recovered with soil to protect it over the winter.
Soil – AgriculturE – food
The main agricultural land use around Yeavering today is grazing for livestock, both sheep and cattle. Grain has been grown in this area. One of the boards in the museum states that rye, barley, wheat and oats have always grown well in the Millfield Basin – an extensive area of fertile land to the east of the Yeavering site. And the crop marks that reveaed the outline of the buildings were first seen when oats covered the land in 1949.
Of interest to Living Field readers may be the importance of soil condition, both in locating the structures initially and then photographing their exposed outlines. Cropmarks are ‘negative structures’ differing from the surrounding soil in the the type of soil that filled the space when the original structures rotted or were removed [4]. If topsoil fell into the spaces, it would probably have contained more organic matter than the surrounding subsoil, and hence have a greater capacity to hold water.
Plants growing in this deeper, more organic material may absorb and reflect a different amount or a different quality of incoming solar radiation. Especially in a dry year, plants here remain greener and unwithered for longer into the summer.
The excavations also reveal the extent to which human habitation and farming influence the erodability of soil, its movement across and out of the area, leading to variation in depth. ‘Centuries of ploughing’ had eroded topsoil from the crest of the site and repositioned it towards the edges. The archaeologists could even tell whether a sub-soil had been previously cultivated or not by its feel and sound when turned with a trowel [4].
LIVESTOCK
Many animal bones and bone-fragments were found at the site. Analysis by ES Higgs and M Jarman [4, 6] showed cattle were by far the predominant livestock rather than sheep, pig or goat. Yet it’s the age when the catttle were killed that tells us something of the pressures on livestock farming at that time, pressures not much different from what they are today.
Livestock need to be fed through the winter to keep them alive. Living grass may prove insufficient, so the herd is sustained with stored hay or grain. Breeding cows that perpetuate the herd have to be prioritised to ensure they survive. But what of the general cattle if feed is likely to run out.
Higgs and Jarman propose that cattle were killed early in their growth cycle, well before they reached full size. The collection of bones indicate age at death had two peaks – 6-11 months and 24-30 months. The first group, born in late spring and early summer, were killed over the following winter, presumably to leave enough feed for the rest of the herd. The second group were fed through the first winter, then a second, before being killed. The relatively short life-span of the cattle points to the pressure on farming to balance size of the herd, winter feed and the need for food.
Today, overwintering cattle, whether kept indoors or on grass, have their food supplemented by grain or silage, possible with concentrates, sourceable from a range of local and international supply chains. At Yeavering, they had only what they could produce and save from local fields.
The future
The Yeavering / Ad Gefrin site is now managed by the Gefrin Trust [2]. The following is extracted from their web site – “In 2002 Ad Gefrin, the physical site and the ongoing story, passed into the hands of The Gefrin Trust. Our aim is to preserve, investigate and recount the history and impact of this important site in the north Cheviot hills, from prehistory right up to the latest investigations and finds.” The Trust’s web offers several free downloadable publications on the region’s history and archaeology.
[2] Yeavering archaeological site: The Gefrin Trust describes the continuing excavations and offers several free downloadable publications on the history and archaeology of the region. See also Canmore – Excavations at Yeavering Bell.
[3] The goats in the name have been around for millenia. They were once farmed, then went feral and now form a wild landrace of the British Primitive Goat. They are declining and under threat of extinction: Northumberland National Park; British Primitive Goat Research Group.
[4] Hope-Taylor, B (1977) Yeavering – an Anglo-British centre of early Northumbria. English Heritage. Report with many figures and plates downloadable at the Archaeology Data Service; and the Gefrin Trust.
[6] ES Higgs and M Jarman: the report [4] gives no information on the people who analysed the animal bones from Yeavering. Higgs and Jarman were well-known archaeological pioneers and scholars who made major contributions to studies of the past e.g., Higgs, E. S. and Jarman, M. (1975) Palaeoeconomy. In E. S. Higgs and M. Jarman (eds.) Palaeoeconomy, 1-7. Cambridge, Cambridge University Press.
[7] For more on the analysis and meaning of animal bones in archaeology, see this online publication: Baker P, Worley F (2019) Animal Bones and Archaeology – Recovery to Archive. Historic England Handbooks for Archaeology.
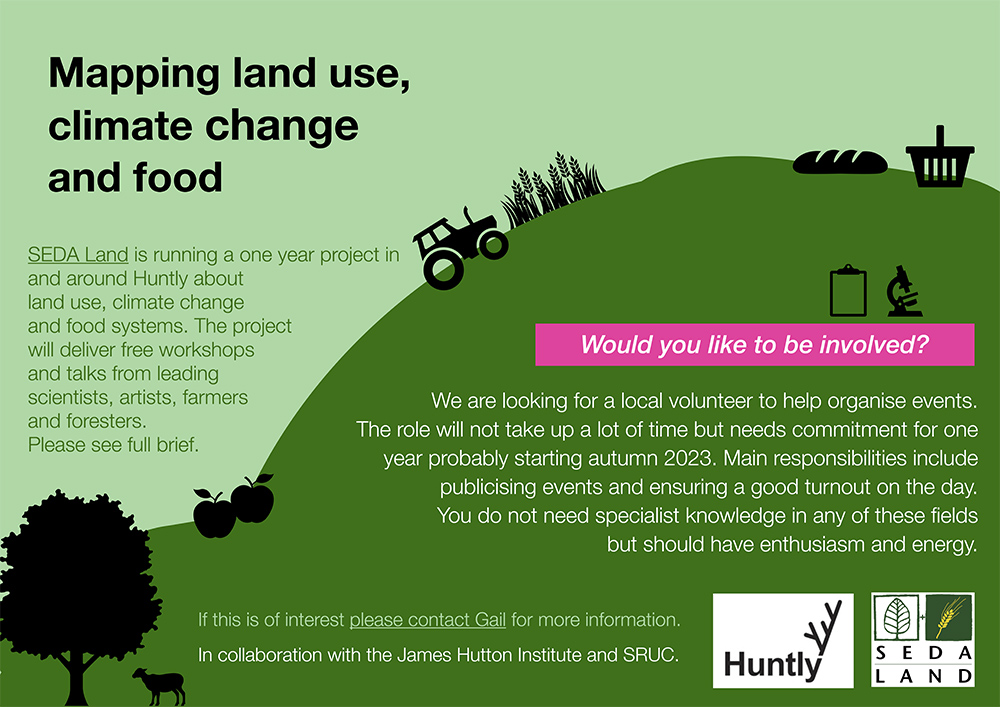
This project – Mapping Land Use, Climate Change and Food – has developed over the last couple of years from an idea into funded reality and now SEDA Land is looking for volunteers to help organise events around Huntly.
AIMS
The Project will work with the community of Huntly [1], Aberdeenshire, to investigate the impact of climate change and alternative food systems on the local area.
SEDA Land writes: “We will investigate the long-term effects of land-use decisions on climate change and the food chain using a variety of tools over the next three years. This will be a collaboration between the community, artists, scientists and local landowners. We will also involve innovative food producers and farmers.”
All the tools proposed in this project are aimed to help the community understand and visualise a possible alternative and productive ecological landscape that serves the climate, the community and which could lead to innovative new forms of employment in the area.
This proposal addresses three of the recommendations from SEDA’s “A New Vision for Land Use in Scotland 6 Conversations” published in partnership with the SRUC and the James Hutton Institute in August 2021, in particular the healthy food strategy [2].
SEDA Land is part of the Scottish Ecological Design Association (SEDA).
Advertisement for the Land Mapping project
Why Huntly?
Huntly was chosen because it is a good example of a mid-sized (population of 4,460) highland town, where surrounding farmland is predominantly used for grazing. We will be seeking to dispel the stereotypical view of the Highlands as sheep-grazed uplands, and explore the potential for alternative land uses – introducing the local community and local farmers to the scope for growing food on slopes; seasonal food; foraged food and indoor-grown food. We will also demonstrate that alternative farming brings increased biodiversity, carbon storage and other benefits.
SEDA Land already has strong connections with Huntly Development Trust, The Deveron Project (a local arts group) and The Gordon Schools (local primary and secondary schools). The development trust owns 63 acres of community land at Greenmyres, five miles southwest of the town. This should permit any residents who are inspired by our project to start using the land in a regenerative way for themselves. We have also established links with Beldorney Estate where we are able to run workshops and the arts projects.
“I think it is really helpful to use art to get past the usual narratives in which there is a designated ‘bad actor’ – a ‘villain’ to protest against. I think art can be great at showing our common humanity and showing that the ‘villain’ is not a person or group of people, but certain aspects of human nature, and of course, climate change itself”.
Sophie Cooke, artist
Toolbox
These tools are intended to engage people in new ways of thinking about the land, climate change and their food systems.
An interactive computer game – the digital game is being developed by students at Abertay University in Dundee to highlight the complex interrelatedness of climate change, biodiversity, land use and food sourcing . Primarily aimed at 13-45-year-olds, the game will require players to balance the uses and products of land to the best advantage of the community and the planet, measured in outcomes such as carbon capture, food sovereignty and health and well-being. We believe it is easier for people to visualise the palimpsest of issues involved if these can be presented graphically and innovatively.
Biophysical data collection – The community will seek to define its present and future needs with the help of scientists and artists, addressing issues such as resilience and a “just transition”. Data will be collated about land use and food sourcing both locally and globally – covering soil health, vegetation and climate. New information will be gathered about local food sources and waste management.
Field workshops – Professionals (soil scientists, regenerative farming experts, forestry experts, food entrepreneurs etc) will run workshops with the Huntly community, local farmers, foresters and landowners to develop/complement the ecological themes above. Artists will use creativity and storytelling to communicate ideas between the various stakeholder groups.
Artistic pieces – Two community projects are planned to be run by a visual artist and a poet to produce works of art in the landscape around Huntly relating to the aims of the project and using material from the workshops.
Mapping
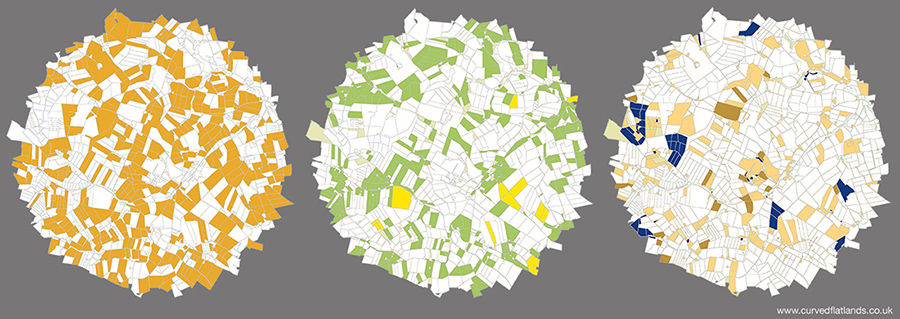
We intend to use maps of all types to make it easier for people to visualise what effect climate change is expected to have on their local area – including in scenarios such as if there is no change to the current farming practices and in the event of bold and imaginative alternatives being adopted. These will include maps showing existing soil types, water, climate etc. along with maps drawn up with the community using local knowledge and drone footage.
Examples of maps and mapping are given on the Living Field editor’s curvedflatlands web pages [3].
Mapping land use: an area (not Huntly) divided into fields and other land parcels by usage – grass for livestock (left), arable crops such as barley and wheat (centre), and the remaining agriculture and woodland (right). Data from the James Hutton Institute. Original on curvedflatlands web [3].
The above text and image, apart from the maps, are extracted from the full project description available available as a PDF file [4].
For further info or if you want to be involved, contact Gail Halvorsen by email: land@seda.uk.net.
Bere – the barley landrace. Exploring its potential with growers. Forming a Bere network. Visiting sites in July 2023. Shared expertise and experience.
By Lawrie Brown
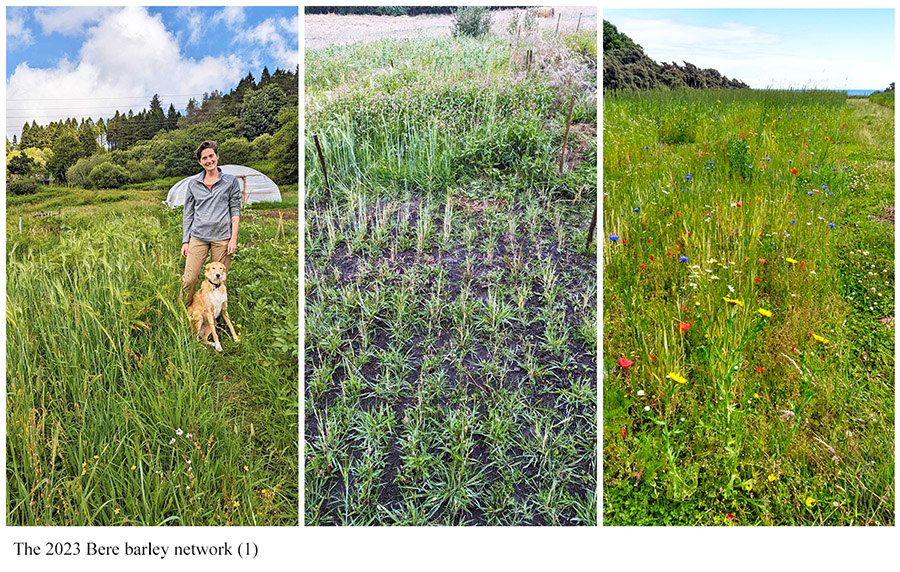
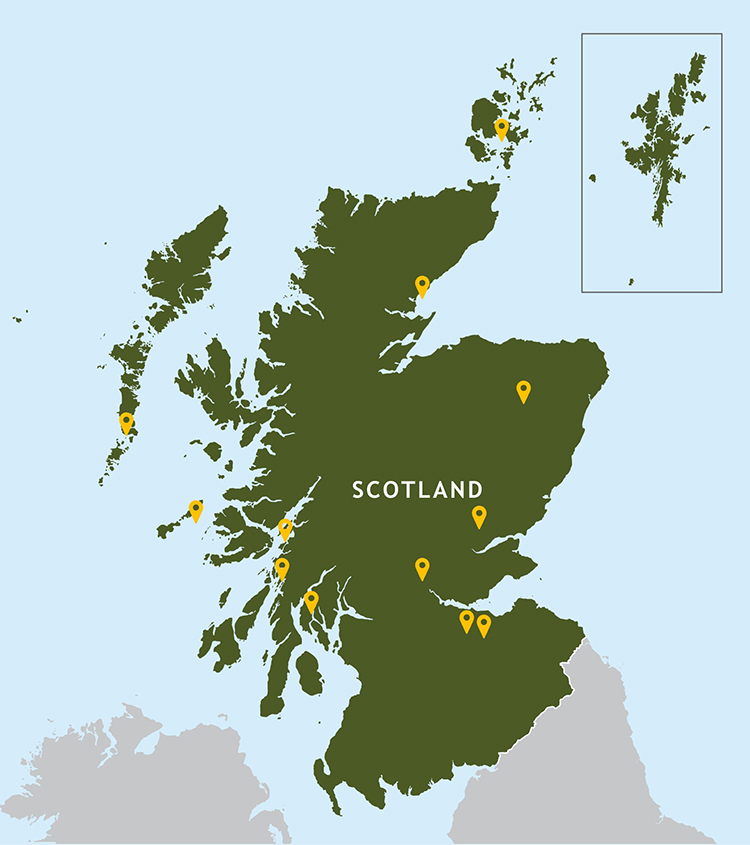
An exciting new initiative involving volunteer growers across Scotland is using a tricot participatory selection approach [1] with the purpose of understanding and selecting the best Bere varieties for different production systems and locations. We are building a growing network of interested growers, currently 16 in total, who were sent starter packs early in the spring. Each participant received seed for 3 barley types, 2 Beres (with different origins) and 1 control (a modern cultivar) which have been sown this season and observations, samples and measurements are being collected.
Taking the view on our bere barley trip around Scotland (Lawrie Brown)
Edinburgh to Orkney| Hebrides to Aberdeen
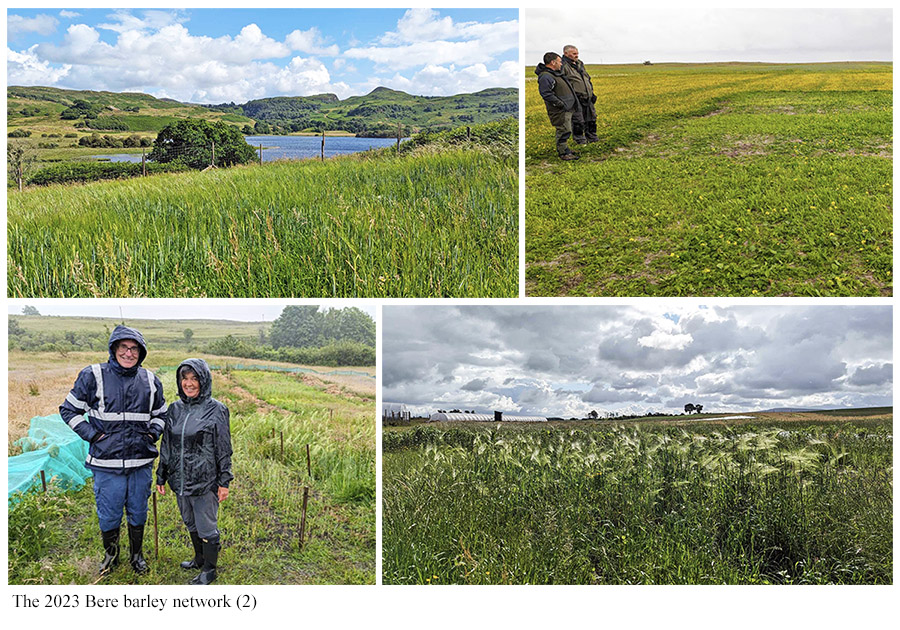
In June, we had the tough job of visiting as many of the participants as possible. This involved a road trip across Scotland visiting a range of sites from Edinburgh and Aberdeen to Stirling, Argyll, Oban and the Isles of Coll, Lismore, South Uist and Orkney. This was a fascinating trip as we learned of the various personal motivations and interests for growing Bere barley from bread making to distilling and heritage conservation to feeding cattle. We met some really interesting people along the way who opened their doors to us and it was great to see small pockets of Bere being reintroduced to sites around Scotland.
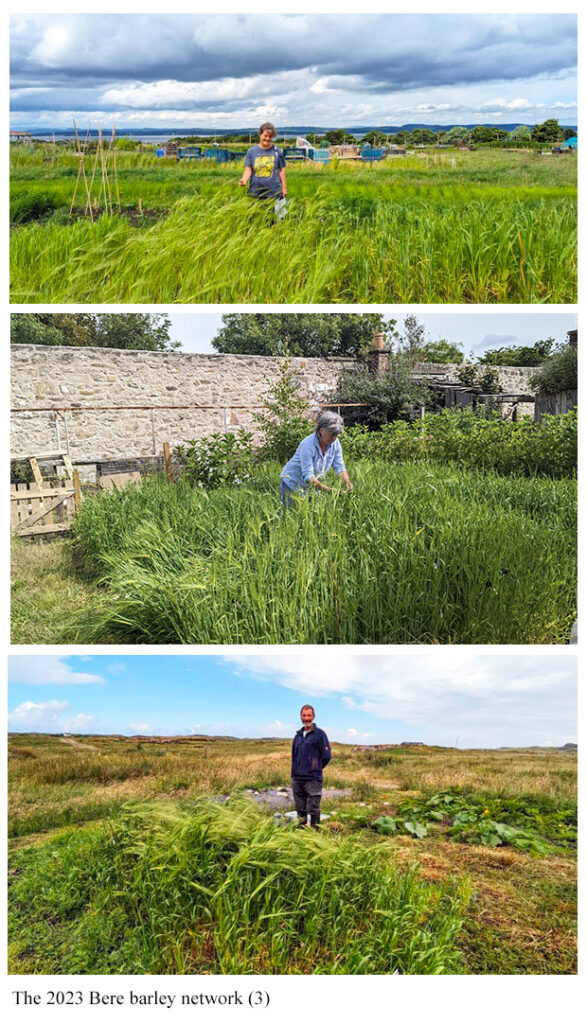
The trial sites this year were small (usually plots of 2 x 6 m) as we had a restricted amounts of seed for distribution. However, next year we will be able to supply larger quantities for larger trial areas and more volunteer participants. Growers were free to apply whatever treatments they wished with some applying seaweed and/or manure as fertiliser while others trialled different tillage treatments. Most were grown without any weed control.
Left – on a smallholding near Colintraive, Argyll, this newly cultivated land had been overrun with rushes and bracken. Centre – on the Isle of Lismore where different tillage methods have been trialled. Right – at Dunrobin Castle where bere is grown with wild flowers for traditional whisky making. (Lawrie Brown).
Shared experience | sharing knowledge
We are looking forward to collating all the data at the end of the season so we can see if specific beres prefer particular environments or treatments and the results will be shared with all growers through online groups and/or face-to-face workshops.
By working together and sharing experiences and information we hope we can all learn something new about the opportunities this ancient grain, Bere barley, can offer Scottish growers.
Left upper – at Glen Lonan near Oban, plots had a seaweed addition plus a kelp foliar spray. Right upper – at a croft on South Uist, bere sown late but already showing advantage of fertilisation with seaweed. Left lower – enjoying the weather in Isle of Lismore. Right lower – plots near Stirling. (Lawrie Brown)
Join the Bere net?
If you would like to get involved in next year’s trials and join the network or find out more, feel free to contact me on lawrie.brown@hutton.ac.uk.
Lawrie works at the James Hutton Institute as a Research Scientist in the Plant Soil Interactions group of Ecological Sciences. Lawrie’s colleagues Molly Brown and Tim George were also involved in visiting the disperse and remote locations around Scotland.
References | sources | links
[1] ‘Tricot’ is short for Triadic comparison of technology options – “a research methodology that helps farmers to identify the most suitable technologies for the local conditions of their farm .… engages farmers as ‘farmer researchers’ in the testing or validation of new crop varieties and other promising technologies”. To find out more about the Tricot approach, visit the Alliance Bioversity & CIAT site at Tricot Aproach. Guide for large-scale participatory experiments. The 2020 report by van Etten and co-authors can be downloaded there. The Alliance’s wider aims in climate change, biodiversity loss, environmental degradation and malnutrition an be viewed at their home page.
[2] For more about bere on this web site: Bere barley at the Living Field gives a introduction to the plant and crop . Bere country shows areas grown with bere and barley in the first crop census in Scotland, 1854. Bere in Lawson’s Synopsis for the different forms of bere and other old barley varieties trialled by the Lawsons (seedsmen) near Edinburgh in the 1800s. For links to all this web site’s articles on bere, including recipes, see Bere line – rhymes with hairline.
Upper – Lauriston Farm, Edinburgh, the first to be sown back in March 2023, the grain to be supplied to a local bakery. Middle -at Granton Walled Garden, Edinburgh, where the modern cultivar was showing signs of manganese deficiency. Lower – on the Isle of Coll, where the modern cultivar was struggling to survive. (Lawrie Brown)
Ed: thanks to Lawrie for introducing the Bere net – pleased to hear that the article has helped to recruit more growers (11 Oct 2023)
Being the first part of an article by singer and musician Russ Clare on a song about grain crops and their importance in the folk tradition.
History of a song
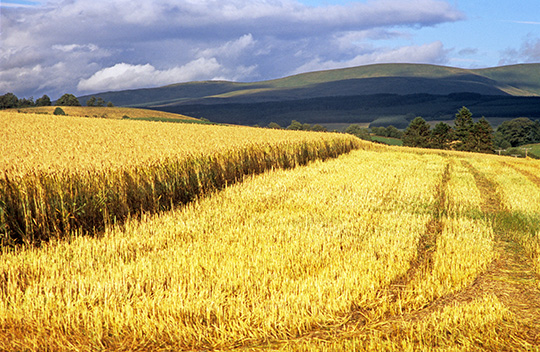
The corpus of rural England’s traditional balladry is admired for its engaging stories from the past still relevant today, and beautiful melodies often with a quirkiness towards time signature and modality. It’s a treasure-trove for singers. One such that I love to sing is All among the barley, also commonly known as The Ripe and Bearded Barley:
Come out, it's now September, the Hunters' moon's begun
And through the wheaten stubble is heard the frequent gun
The leaves are turning yellow, and fading into red
While the ripe and bearded barley is hanging down his head

Chorus: All among the barley, who would not be blythe? When the ripe and bearded barley is smiling on the scythe

The wheat is like a rich man, he's sleek and well-to-do
The oats are like the young girls, they're thin and dancing too
The rye is like a miser, all sulky, lean and small
While the ripe and bearded barley is the monarch of them all

The Spring is like a fair maid that does not know her mind
The Summer is a tyrant of most ungrateful kind
But the Autumn is an old friend who pleases all she can
Brings the ripe and bearded barley to gladden the hearts of man
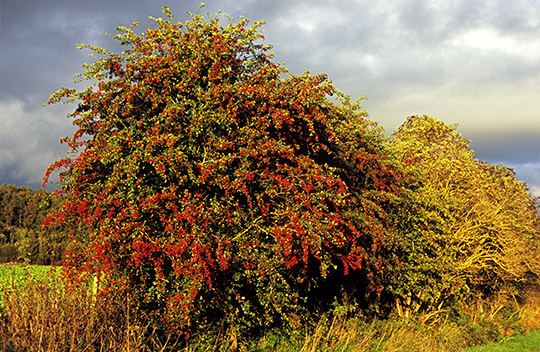
Autumn hawthorn by Russ Clare
I came across this little folk song gem in 1974 while browsing a poetry anthology in a Nottingham school library. My attention was captured by its portrayal of the changing seasons, setting the scene for a playful imagination of cereal crops and with special praise for barley, the brewers and distillers source of alcohol. I fondly imagined the song to have had a life in the past among the country people of rural Leicestershire, where I was living at the time. A likely favourite at harvest homes, those end of harvest celebrations of feasting, drinking, and singing. While All among the barley deserved a place in my growing repertoire for singing in folk song clubs, in this case no tune was given, merely a credit to Folk Songs of the Upper Thames. I had been unaware of the collection, and in those pre-internet times further enquiry soon came to a halt. So the hunt was on for a suitable melody.
The search ended with a dance tune, TheTip Top Polka, a personal ‘ear worm’ from listening to the brass band accompaniment for the Britannia Coconut Dancers on their Easter Saturday procession around Bacup, their home town in Lancashire. My mind attached All among the barley‘s words to the melody. It seemed a near perfect fit, and I have stuck with it ever-since, giving the song an airing each Autumn. Listen to a recording here.
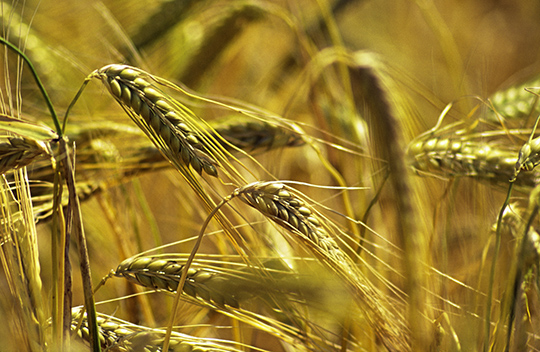
Barley by Russ Clare
All Among the Barley – a novel by Melissa Harrison
It’s likely I had the song in mind when, in September 2018, I noticed an intriguing newspaper review of All Among the Barley, a novel by Melissa Harrison. It is set in Suffolk in the 1930s, where local fourteen year old Edie meets Constance, a London writer on a mission (ostensibly) to chronicle the traditions of an isolated rural community challenged by modernity.
Harrison has garnered much critical acclaim for her evocation of a way of life in decline – the closeness and beauty of nature, more bountiful and diverse than now; age-old patterns of work driven by the seasons; the tension created from clinging to the familiar while recognising the need to embrace innovation. In a closing scene, following the story’s tragic conclusion, Edie’s grandfather sings to her. She is comforted by his songs, recognising the continuity they represent in the history of her family and home; songs passed down the generations.
In fiction, Edie heard her grandfather sing All Among the Barley. But the song has a real-life story of its own, about its origin and popularity, and its telling needs first a consideration of the nature of traditional folk song.
Harvest by Russ Clare
The song collectors
We will be forever in debt to Victorian and Edwardian song collectors for their rescue of so much of our traditional folk heritage, seemingly heading for extinction as singers aged and their art succumbed to rural depopulation, urbanisation and popular entertainment in the music halls. Between 1890 and 1920, Cecil Sharp, Lucy Broadwood, Ralph Vaughan Williams, Frank Kidson, and Percy Grainger, notable among others, wrote down thousands of song lyrics and tunes from country people, travelling widely, often by bicycle, in their search for singers. Sharp, in particular, was driven by an ideological attempt to use folk song as a resource to establish a National music with an identifiable English style; Vaughan Williams, though less ideological was arguably more successful in that pursuit.
In his essay, English Folk Song: Some Conclusions (1907), Sharp promoted the idea of anonymous community authorship of songs and their subsequent adaptation as they were passed around and down generations in a purely oral manner. It is unlikely, however, an oral tradition can survive exclusively alongside written communication – a degree of coexistence is more likely.
A community’s songs must be either composed from within, learned by listening to other singers or obtained from printed sources: the relative importance of these routes is keenly debated. Songs on commercially produced broadsides and chapbooks – written by artisan scribes or purloined from other sources – were commonly sold on the street from the 16th century. They were very popular, for it is a myth, although a popular notion, that illiteracy among the rural working class was widespread before 1700 and beyond. The work of folk song scholar, Steve Gardham, does support the idea that many songs, if not most, entered the tradition from these written sources. His analysis of 705 songs found in oral tradition in England between 1840 and 1940 showed 88% had their earliest extant version in some form of urban commercial production (Traditional Song Forum online address September 2020, from 47:50). It is, however, widely accepted, as Sharp first suggested, an oral process that turns a song from whatever source into a traditional folk song. Shared in a community by listening and learning, songs have been adapted and shaped by singers’ inherent creative talent and passed on to succeeding generations, thus accounting for the rich lyrical and musical variation found by collectors.
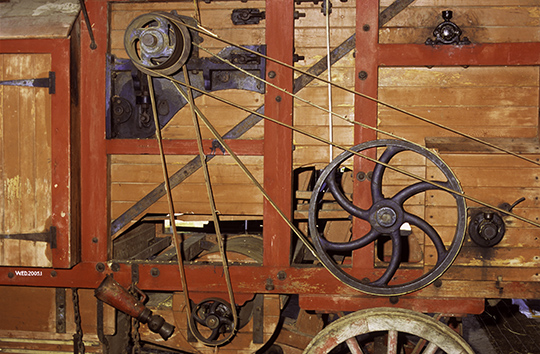
Thresher by Russ Clare
Origins of a song
So what of the origins and traditional status of All Among the Barley?
The earliest record of it is a composition by Elizabeth Stirling, published in 1851 as a four part (SATB) choral arrangement in Novello’s Part Song Book. Stirling (1819 – 1895), a career church organist and composer who studied at the Royal Academy of Music in London, enigmatically credits the lyrics to A T who has never been identified. Speculation among music scholars that it might be Alfred Lord Tennyson (1809 – 1892) is not backed by hard evidence, but they were contemporaries and both living in London in the 1840s, so a song writing partnership is not inconceivable. Moreover, in the opening verses of the The Lady of Shalott (1832), there is some resonance with All Among the Barley‘s lyrics:
On either side the river lie
Long fields of barley and of rye...
	.......

Underneath the bearded barley,
The reaper, reaping late and early....
An indication of a common author, or mere coincidence?
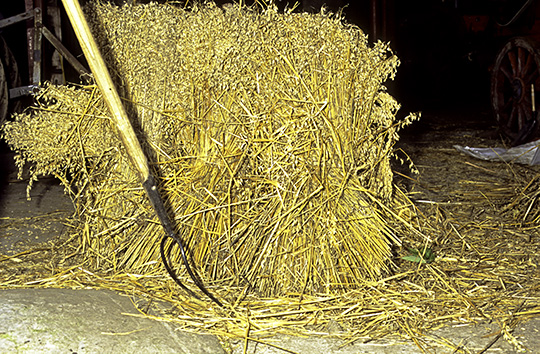
Sheaves and pitchfork by Russ Clare
A song spreads far and wide
A judging panel of Novella’s collection awarded 2nd prize to All Among the Barley, and, among Stirling’s various organ compositions and song arrangements, it was, and remains Stirling’s most popular work, for which the sheet music is still available. It soon became a frequent choice for amateur choirs, as in the inaugural concert of Weymouth Choral Society on February 26th, 1862, and a concert given by Bethlem Hospital (Bedlam) Glee and Madrigal Club on 17 March 1879.
Writing in English Dance and Song magazine in 1967, Tony Wales cites several sources indicating the song’s popularity in schools well into the 20th Century. All Among the Barley soon found its way to publishers of songbooks such as The Fashionable Songbook (Routledge, 1865) and of broadsides across the country, including J Harkness of Preston in (1874) among many.
Stirling’s song also became popular in the USA; the Library of Congress records an arrangement in three parts for women’s voices (Lee & Walker, Philadelphia, 1871), and a version with a message from the Women’s Temperance Society in Living Waters—A Collection of Popular Temperance Songs, Choruses, Quartets (Peters, J. L., New York, 1874):
All among the Barley, wander you and I
Tho' we love the smiling Barley, we shun the dreadful Rye
Tho' we love the happy Barley, we shun the dreadful Rye
It was also included in resources for schools, as in The Golden Robin (W.O. Perkins, Boston 1863).
A popular song in print, then, and the work of a musician and, perhaps, a lyricist too, who were some steps removed from its bucolic setting. Instances of the song in oral tradition are surprisingly sparse, however. Among a plethora of printed sources, Steve Roud’s eponymous Folk Song Index cites All Among the Barley for nine singers, eight with records made between 1914 and 1974 (a ninth is undated). So, an enduring circulation among country singers in 20th Century England is suggested, and all evidence is consistent with All Among the Barley entering the tradition from written sources traceable to Sterling’s original score.
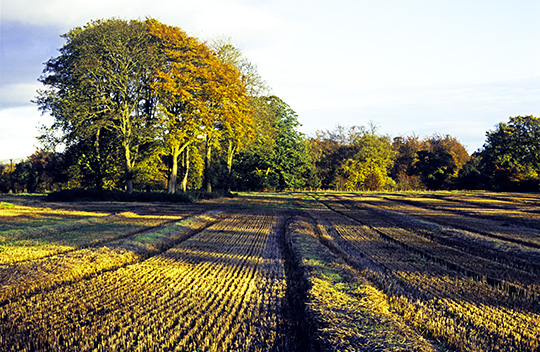
Stubble field by Russ Clare
One song collector and one singer deserve more attention
Alfred Williams (1877 – 1930) collected folk songs from the Upper Thames Valley in Gloucestershire, Wiltshire and Oxfordshire. In contrast to Sharp and other materially comfortable, middle class collectors, Williams was born into working class poverty – in the village of South Marston, near Swindon. He was a half-time farmhand at eight, full-time by eleven, and a Swindon railway factory worker for 23 years. Williams was, nevertheless, an effective autodidact. Rising early to work before a factory shift and resuming late into the night, he published several volumes of poetry and social history, drawing on a love for his native Wiltshire countryside, and a commitment to recording the local people’s way of life. Along the way he found time to learn several languages, including French, Latin, Greek and Sanskrit. His most enduring work, Life in a Railway Factory documented the drudgery that led to his health break down and reliance on writing for a living.
Between 1914 and 1916, Williams cycled thousands of miles collecting the words of nearly 800 songs; a selection of some 200 were published as Folk Songs of the Upper Thames in 1923 “The greater part of the work of collecting the songs must be done at night, and winter is the best time, as the men are then free from their labours after tea.” On one such cold, night time journey Williams collected The Ripe and Bearded Barley from Henry Sirman, a farm hand of Stanton Harcourt. Williams lacked the skills to note down tunes, but the songs’musicality was not his prime concern; he was more interested in the significance of the songs in the lives of his informants. His own life was tragically short, worn down by poverty and a punishing work schedule.
Autumn beech leaves by Russ Clare
To its considerable surprise and delight, the folk music scene of the 1970s discovered a traditional singer living, and hiding in plain sight, in Norfolk. Walter Pardon (1914 – 1996), a carpenter, passed his entire life, apart from four years war service at Aldershot, in the village of Knapton. He had a repertoire of around 150 songs, mainly learned by listening to family members. As a younger man there were few opportunities for social singing or public performance so he sang for his own entertainment, continuing in the isolation of the family cottage long after both parents had died.
Walter’s cousin Roger Dixon, a history teacher, aware of the interest Walter’s singing would arouse, recorded 20 songs and passed the tape to professional folk singer, Peter Bellmay. A late flowering singing career followed for Walter, who performed at clubs and festivals, recorded several CD albums, and sang in Washington at the USA’s 1976 bi-centennial celebrations, before retirement at 75 in 1989. His repertoire is notable for having several exclusive or rarely collected songs, including All Among the Barley. Sung to an approximation of Stirling’s tune, it can be found on Walter’s CD Put a bit of Powder on it, Father and in The British Library Sound Archive.
All Among the Barley has retained its appeal. In the 1980s Cheltenham singers, Mike and Jackie Gabriel, had the lyrics but no tune so composed their own. Robust, invitingly singable, and very much in an English traditional style, it has become, almost, the exclusive melody of choice for today’s singers. Several interpretations can be found on Youtube and variation in words and music shows the ‘folk process’ still at work.
The second part of Russ Clare’s article Social and environmental changes during the life of a song will be published later on this web site.
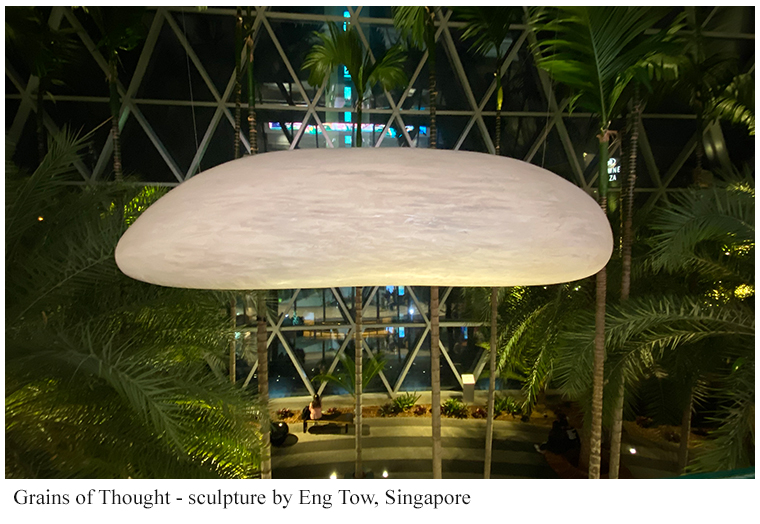
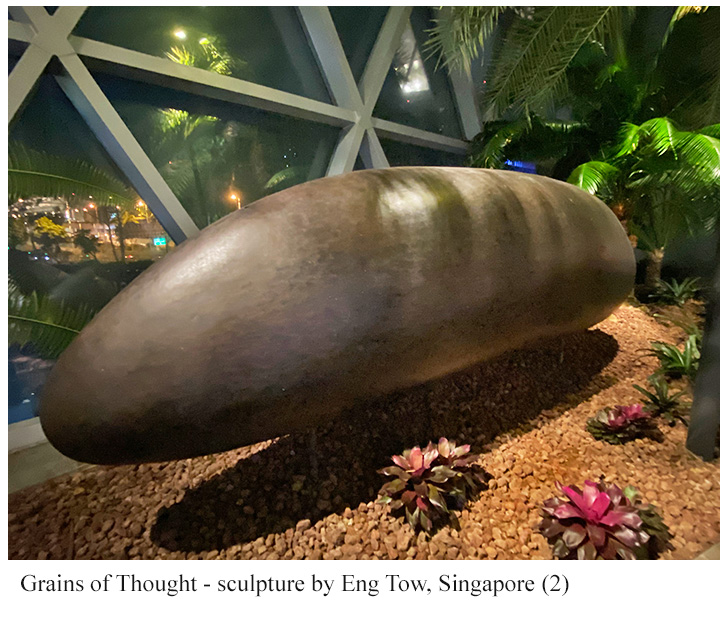
Rice sculpture at Singapore Changi by artist Eng Tow. Rice the feeder of millions. Photographs of rice fields in Laos and Bangladesh. Hanging gardens and waterfall. Bringing plants to people.
Grains of Thought (2015) is the name. Huge grains of rice, magnified from reality many times, made from acrylic and carbon fibre by the artist Eng Tow [1]. They were transferred in 2019 to the South Gateway Garden at Changi Airport from an exhibition at the Asian Civilisations Museum in Singapore [2].
These massive grains sit and hang among moist tropical vegetation inside the South Gateway precinct. All around, people were eating rice at the food stalls and restaurants.
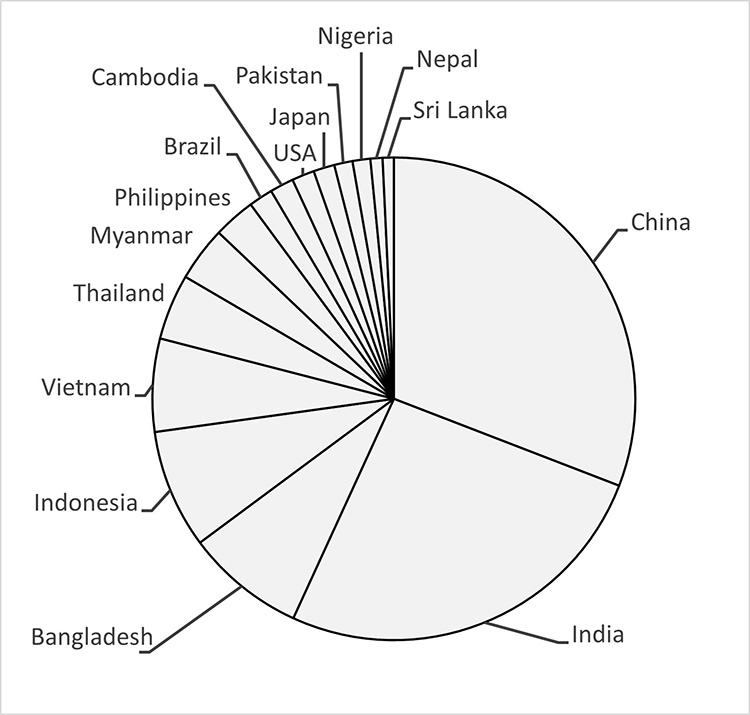
Rice was domesticated in Asia. The climate suits it. Most rice is still grown in Asia. Over three-quarters of the global production comes from China, India, Bangladesh, Indonesia and Vietnam (Fig. 1). Rice is also grown in smaller quantities more widely, for example in the USA, south America, north Africa and southern Europe.
Fig. 1 Distribution of global rice production among countries, mainly in Asia: drawn from statistics of the Food and Agriculture Organisation of the United Nations.
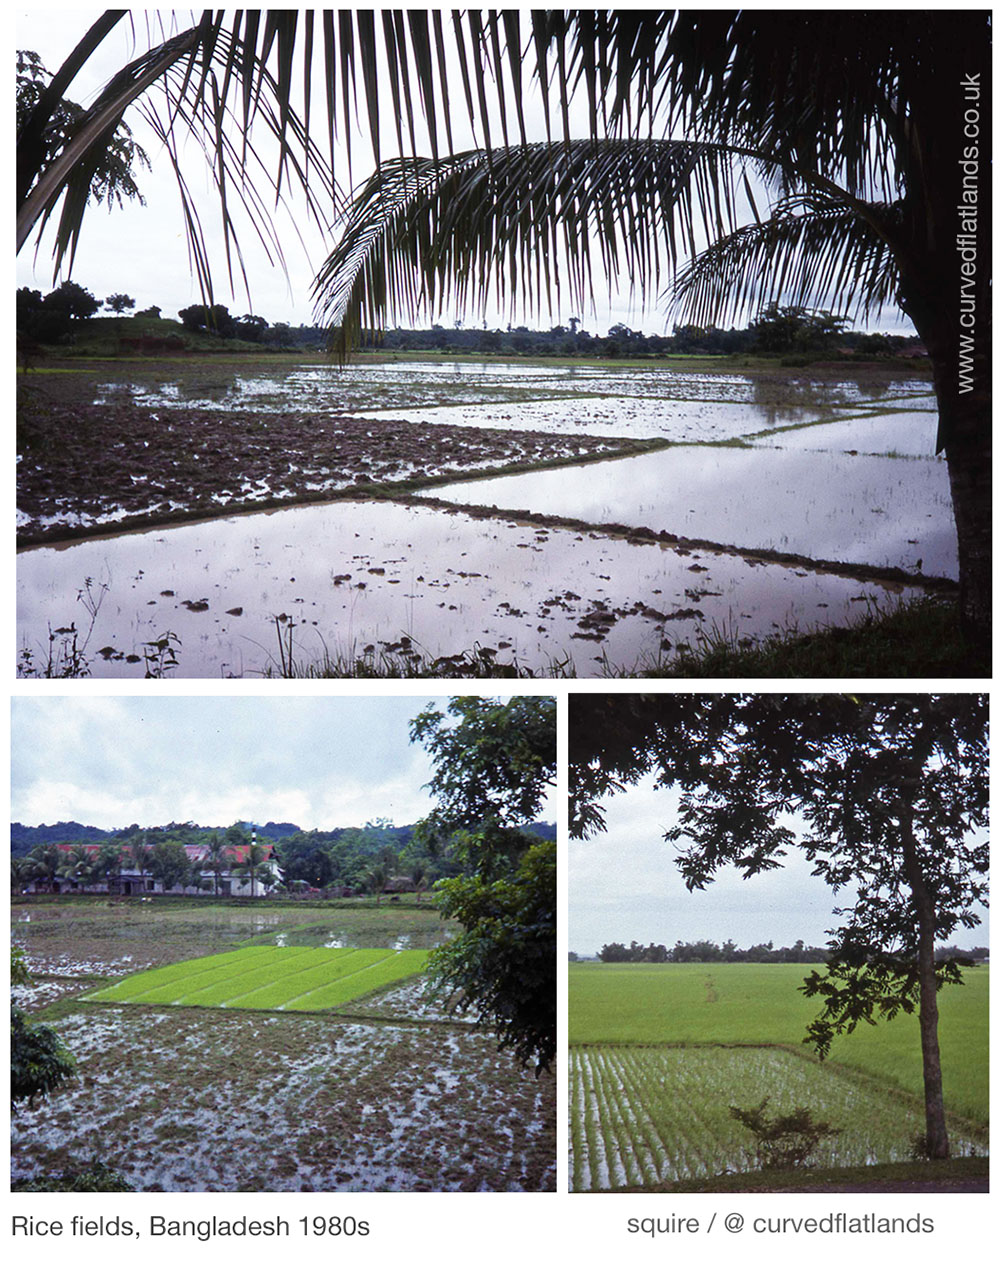
In typical systems of cultivation in Asia, rice is grown in flat fields or terraces, surrounded by bunds made of heaped and compacted soil. The high rainfall of monsoon or wet seasons is retained within the fields or else lifted or pumped into fields from nearby waterways. The rice needs to be submerged in water but it is also better to retain the water and let it evaporate slowly, rather than have it flow downhill taking soil with it. The water is skilfully channelled between fields, sometime over extensive hillslopes and valley bottoms.
Fig 2 Rice fields in Bangladesh: upper, during soil cultivation before planting, hanging fronds are from coconut palms on a roadside; lower left, one field planted centre; lower right, all fields planted with young rice in lines.
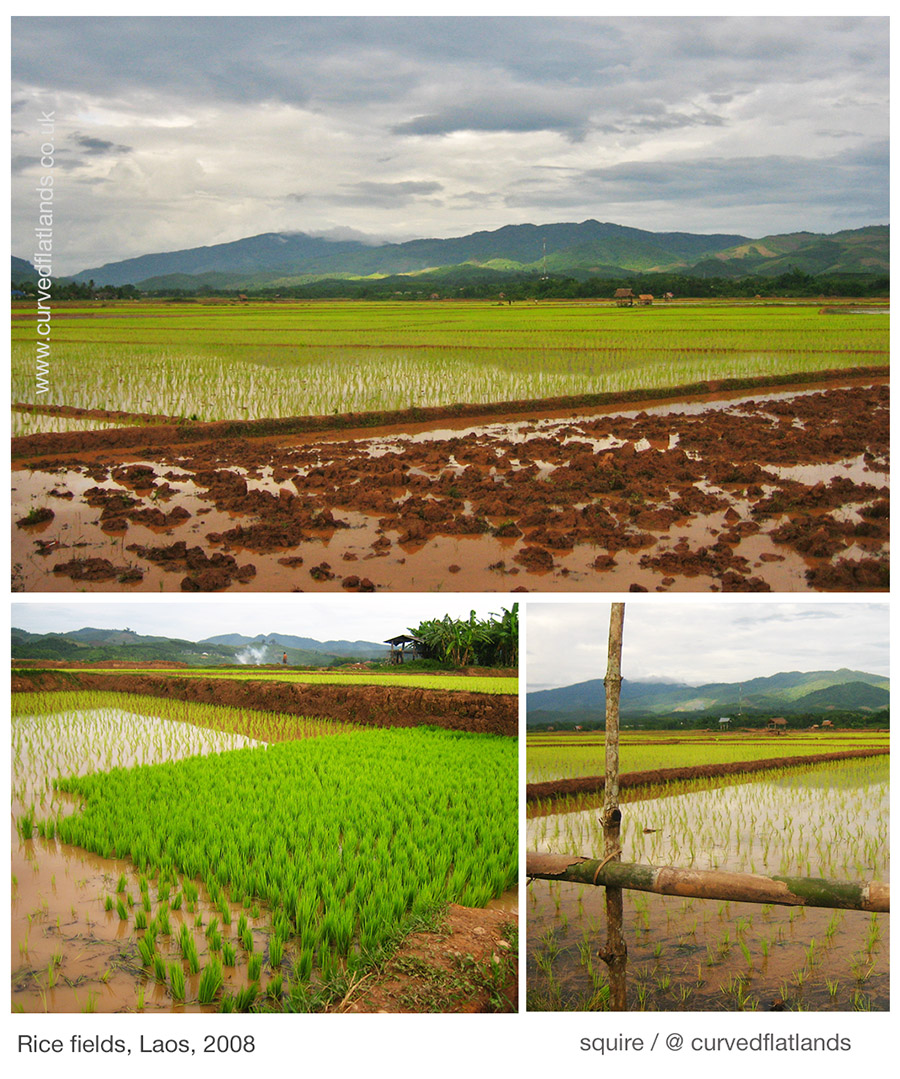
Two examples of this ’paddy’ system are shown on this page, from Bangladesh and Laos. Once the soil has been cultivated, the rice is planted out into fields from ‘nurseries’. The lower parts of the stems are submerged for most of the plant’s life. The water has usually evaporated or else drained before harvest.
Not all rice is grown in this way: some varieties of the crop are cultivated on dry land and others in deep water where the stems extend upwards as seasonal flooding increases the distance from soil to water-surface.
Fig. 3 Rice fields in Laos: upper, foreground soil still being cultivated, young rice planted behind; lower left, ‘nursery’ from which the plants are moved to their final position in fields, the high bund in middle distance separates fields at different levels; lower right, young rice planted.
Global reach
In Scotland, the main grains since agriculture arrived here have been oats and barley, also wheat and rye. All were domesticated just to the east of the Mediterranean and were moved across Europe to reach Scotland >5000 years ago. Rice has been imported into north-west Europe for many centuries, but it was never a main source of carbohydrate … that is, not until the last 50 years or so [3]. In the 1950s, it was eaten in the home as a sweet milk pudding or added to soups and broths. Imports began to rise in the 1970s and by the 1990s its consumption had increased more than five-fold, making it one of the UK’s major sources of cereal carb [4].
The rice we eat is grown mainly in India, Pakistan, Thailand, USA and Cambodia. Various forms of the grain are now readily available in the UK for home cooking and as meals in carry-outs and restaurants. For example, basmati is the typical rice in Indian cooking while arborio is rounder and softer when cooked, ideal in risottos.
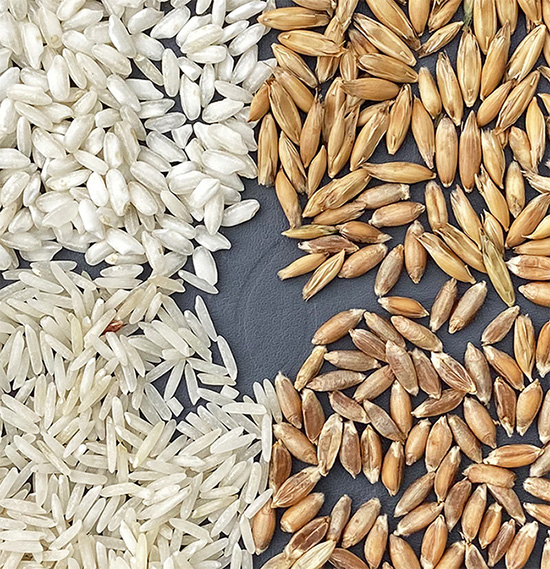
Basmati and arborio grains are shown in the photographs below as most Europeans see them – straight out of the packet. The grains have had their protective coverings removed in processing mills. Two other grains are shown with them: local oats, the protective cover still attached, and emmer wheat for which each grain was taken out of its covering by hand. The emmer and oat were grown in the Living field garden – we tried rice a few years ago. It grew leaves and stems, but did not make it to seeding.
Fig. 4 Grains of arborio rice (top left), oats (upper r), emmer wheat (lower r) and basmati rice (lower l). Grains are 4-5 mm long.
The grains of these four crops differ relatively little in size (although the basmati is thinner than the others). Along with most other cereal grains they are able to survive when dried for long periods in storage. The storability of cereal grains was one of the main factors that encouraged humans to grow seasonal crops and settle in one place. The grains have an optimal geometry for growth on the plant, harvesting, storage, transportation, milling and cooking.
Grains of thought?
Most people who eat a meal of cereals – bread, porridge, pasta, paella, roti, ngaiwa – probably do not see it as once being a collection of individuals on a mother plant. Yet each grain of a cereal originates from a single act of reproduction and lives life encased in its own protective sheath. The yield of a cereal crop is determined by the number of individual grains on a cereal head or spike. The balance between number and size of individuals is influenced by field management and in turn influences the nutritional quality and economic worth of the harvest.
The grains are now unseen in most cereal products. Maybe these giant sculptures can remind us of what most people depend on for life.
The Grains of Thought sculptures are sited within a major complex at the airport in which thousands of tropical plants are nurtured. The centrepiece is the waterfall or ‘rain vortex’, photographs below [5].
[3] Food of the Scots. Volume 5 in A Compendium of Scottish Ethnology. Author: Alexander Fenton. Publisher: John Donald, in association with The European Ethnological Research Centre.
Stable cereal grains domesticated in Africa: pearl millet and sorghum. Grain-packing on the panicle. Drought resistance compared to maize.
The north Atlantic croplands know well wheat, barley and oats, also rye, but some of the most important cereal grains do not grow here. It’s too cold. Of great importance to future food are the grain crops millet and sorghum – out of Africa.
Maize, domesticated in the Americas, came to dominate cereal production in Africa, but only in the last few hundred years. Maize came to the fore because it yields well in moist, fertile soils, its cobs can be easily tranported and its seeds easily cooked.
Before maize, people grew sorghum (Sorghum bicolor), pearl millet Pennisetum typhoides), and related crops such as finger millet (Eleusine coracana). With the rise of maize, they were reduced in area, sometimes found only where it was too dry for maize to yield reliably.
But now their value is being appreciated where maize has come to yield poorly or fail in soils that are not rich enough in nutrients and in climates that are getting drier.
Compared to the cereals we know, the sorghums and millets have unusual grain-bearing structures – commonly called panicles. They hold far more grains than the typical ‘ears’ of wheat and barley.
Pearl millet
Pearl millet panicles are long and round, the grains tightly packed around the outside of a central stem (fig. 1). The grains are held in pairs at the end of short stalks, each having a ring of hairs just in from the grains and more, smaller hairs on the stalk. The grains are protected when young by bracts, just as in our cereals, but the grains elongate and hide the bracts from view. They can be seen if some of the grain falls out.
Figure 1. Structure of panicles of pearl millet: lower shows part of a panicle as seen from the outside; middle right, the outside with some grains present, others having fallen out revealing the holding bracts; top, inside the panicle, grains held in pairs on short hairy stalks grown from the central stem.
Sorghum
Sorghum panicles are looser than those of pearl millet. Some older varieties and landraces are very loose whereas modern varieties tend to be more compact but not as much as pearl millet. Panicles of three sorghum varieties are shown in Fig. 2. The centre one a little more compact than the one on the left. That on the right is very loose – the
Fig. 3. Grain on panicles of (left) pearl millet, and three varieties of sorghum with (rightwards) decreasing grain packing. The square is 10 mm by 10 mm.
Comparison with temperate cereals
How do the panicles compare with wheat and barley? They are all usually much larger (Fig. X)..
Panicles, spikes or ‘ears’ of cereals: 1) emmer wheat, 2) bere barley, 3) bread wheat landrace, 4) and 5) pear millet, small and large panicles, 6) sorghum, intermediate grain packing, 7) sorghum, tight packing, 8) traditional sorghum, loose packing. Origins: 1, 2 and 3 grown in the Living Field garden; 4 to 8 provided by International Crops Research Institute for the Semi-Arid Tropics.
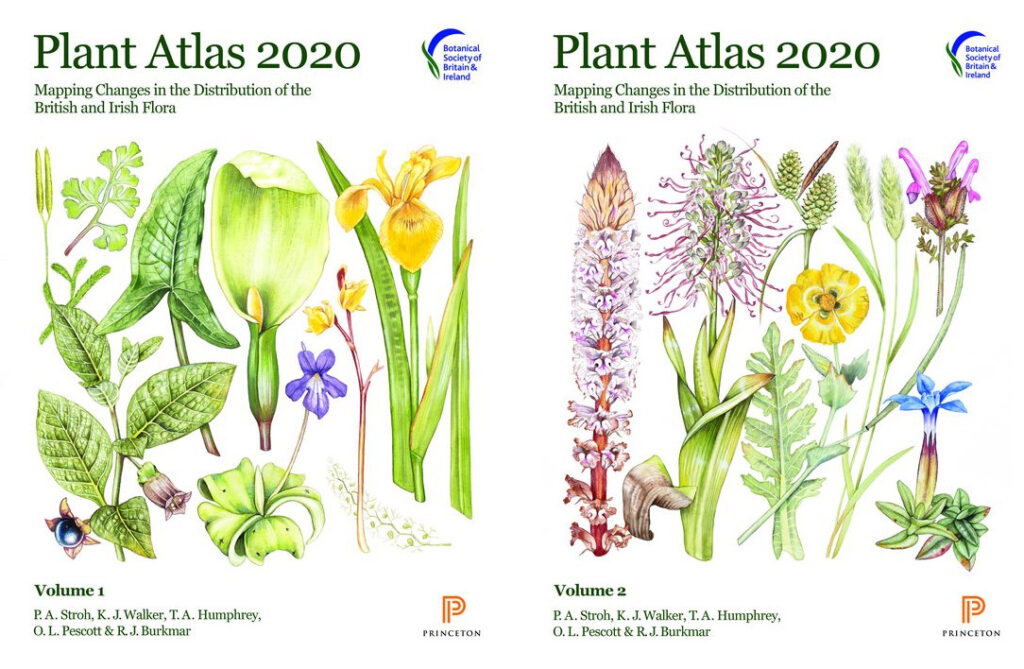
Mapping changes in the distribution of the British and Irish Flora.
Published by the Botanical Society of Britain and Ireland (BSBI) in 2023
Notes from the Online launch 9 March 2023. Web: plantatlas2020.org
Those of us involved in field survey have long valued the plant atlas produced by the Botanical Society of Britain and Ireland (BSBI). The two previous publications, in 1962 and 2002, have been invaluable, and so will the latest version published earlier this year – Plant Atlas 2020.
It took 20 years of field recording and three years of analysis. Thousands of botanists did the surveys, often under the guidance of the county recorders who know their area intimately. In all, they assembled 30 million records, of 3495 species.
Covers of the two volumes of Plant Atlas 2020, accessible online and available to buy as hard copy.
Each species is given a general description, then its altitudinal range, phenology (its sequence of development – vegetative, reproductive, seeding), time trend and a distribution map in 10 km squares over the country.
What of the changes? There’s been some gain – but the main conclusions are continued loss of plant biodiversity. For estimate of changes since the 1950s, plants are placed into one of three classes
native species – of which 53% have declined;
archaeophytes, that have been here a few hundred years – of which 62% have declined;
neophytes or recent introductions – of which 58% have increased.
This summary is no surprise to those who have surveyed plants in managed ecosystems across the country.
Why have natives and archaeophytes declined – loss of habitat, destruction or modification of habitat through intensified management, fertiliser application, pollution, erosion, run-off, drainage, and overgrazing; loss of small farms. Not all is bad – some species such as cornflower have increased in occurrence due to the sowing of wildflower seed mixes. But the overall position is that Britain continues to lose plant species and many of the losses are in arable and grass farmland.
Some of the recent plant introductions are doing the opposite – taking advantage of disturbance. Sitka spruce is one – introduced as a forest plantation tree across the country but now spreading through self seeding. It’s all over the place – on the shores of pristine lochs, in marshland, moving over the moor.
Climate is having an effect. ‘Winners’ are southern species that can take advantage of the warming. ‘Losers’ are montane species suffering due to reduced snow cover and dryness.
What can be done? The online launch gave five key actions:
Protect the best sites.
Allow more space for nature – reduce the pressure.
Ensure plants are taken account of in decisions on land use.
Continued research and monitoring
Raise the awareness of plants – encourage skills in identifying, understanding and managing.
And it’s true plants are generally overlooked by those who manage the countryside. One of the reasons for starting the Living Field project back in 2001 was to raise awareness of lowland plants and their many contributions to ecosystem function and their uses to people through the ages. We’ll continue …. but the pressures against plant diversity are not waning.
We can look back to the BSBI’s efforts before Plant Atlas 2020 …..
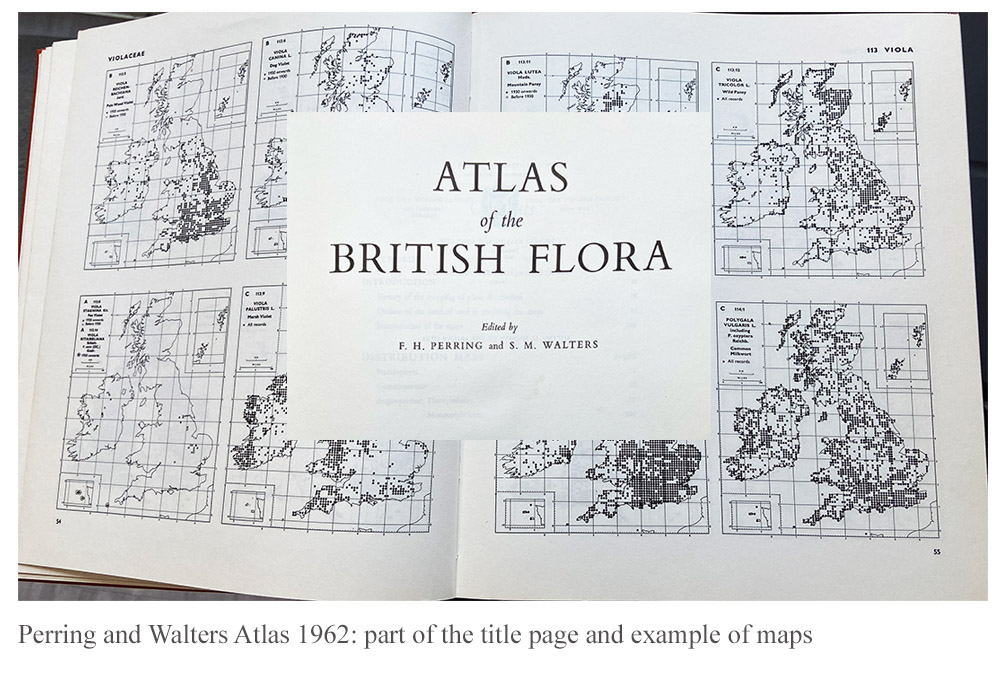
1962 Atlas by Perring and Walters
On joining SCRI, one of the two founder Institutes of the James Hutton, in the 1990s, I found that much of the work was based in crop breeding (potato, soft fruit and barley) and pests (viruses, fungi and insects). Weeds as pests were given less emphasis and money, but arable plants other than crops were still mostly treated as pests. Nevertheless, the Atlas of the British Flora published by the BSBI in 1962, edited by FH Perring and SM Walters, was in the library, originally at the Scottish Plant Breeding Station, which was then at Pentlandfield, Midlothian, before it moved to become part of SCRI in Dundee. The book was bought in July 1962 and cost £3/10. The image above shows a part of the title superimposed on one of the pages showing the distribution maps for the species.
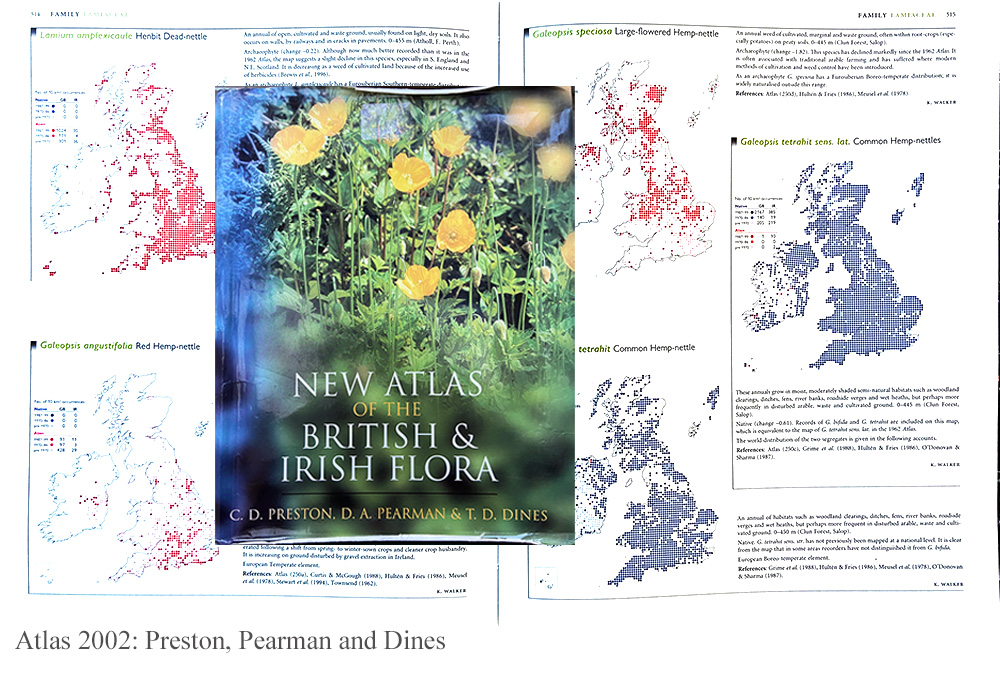
2002 New Atlas of the British and Irish Flora
Gradually during the 1990s the notion was debated that weeds, or as some of us would prefer ….. arable plants, had attributes that were positive for the farmed ecosystem, notably the provision of plant food for beneficial invertebrates such as detritus-feeders, beetles, spiders and pollinators.
In the late 1990s, the research grouping that was to become Agroecology at the James Hutton, began to win research contracts in vegetation dynamics, geneflow and ecological risk assessment. Over several years, the group sampled crops and wild plants in fields from the south coast of England to Ross and Cromarty In Scotland.
Fortunately for us, the revised version of the 1962 Atlas, named The New Atlas of the British and Irish Flora, edited by CD Preston, DA Pearman and TD Dines, was published in 2002. The cover – in our case very worn from much usage of the book – is shown on a page of maps for several species.
The pages chosen showed distributions of the hemp nettles, of the genus Galeopsis, that occurred widely within cropped fields in the east of Scotland at that time, causing little problem as a weed but providing a base for the invertebrate food web.
Thanks
The making of these Flora takes a massive effort from the main editors and organisers but also the thousands of volunteer botanists who survey and identify the plants throughout the country. The Living Field has already used the online edition to answer questions from our correspondents. It’s a fantastic resource ….. there to use.
Links
The Botanical Society of British and Ireland (BSBI) web site – https://bsbi.org
At the Bowhouse, St Monan’s Fife – the first Scottish Real Bread Festival – 25 February 2023 – hosted by Scotland the Bread. The Living Field went to see what was happening.
Well … you can’t grow bread wheats in Scotland they say. But on this day Scotland the Bread [1] hosted the first Scottish Real Bread Festival [2]. The venue – at the Bowhouse, St Monans, Fife [3] – was packed with people seeing, selling, eating and debating flour and bread grown, milled and baked locally.
There were presentations and discussion through of the day, people sitting on hay bales, listening and asking.
Earlier, bakers had entered their loaves in the bread contest. A panel of experts had made a decision and the winners were announced and awarded. The loaves were all laid out on a table and given away at the end of the day.
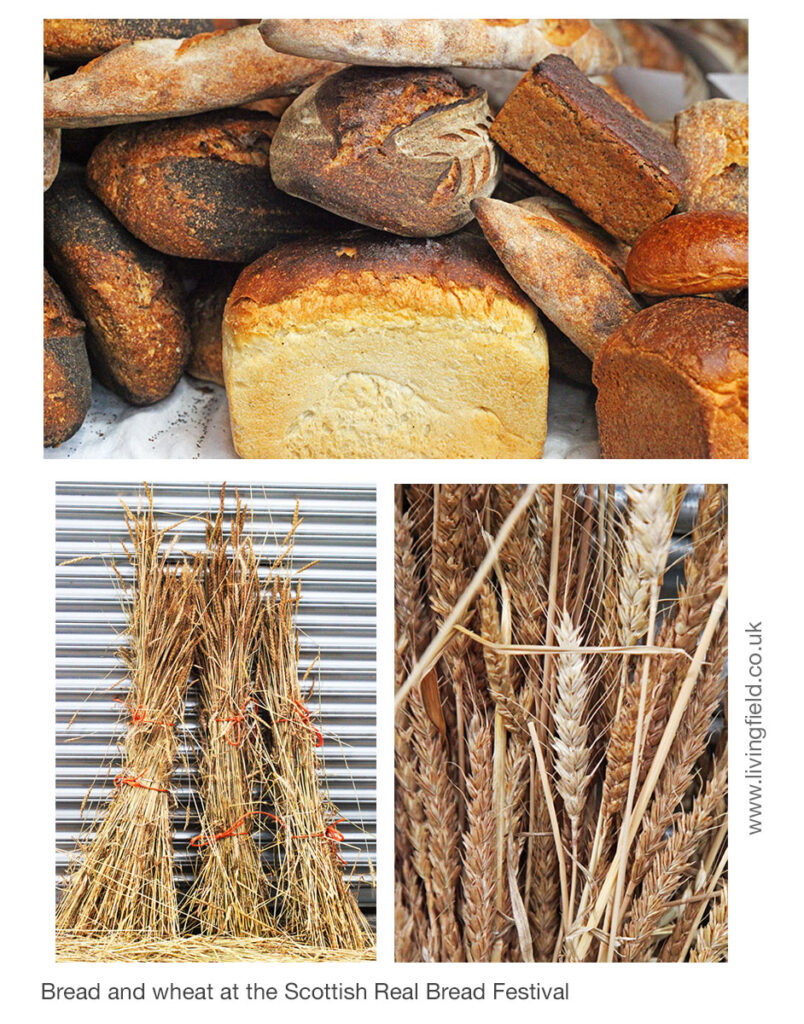
At the first Scottish Real Bread Festival, Bowhouse at St Monans Fife – baked bread loaves and locally grown wheat.
Scotland the Bread‘s own flour, milled from local wheat landraces, was on sale ….. and went like hot loaves.Some sheaves of bread-wheat landraces were on display (lower images above), grown locally in the soil and climate of Fife. The plants are much taller than modern wheat varieties – due to the length of stems or ‘straw’ [4].
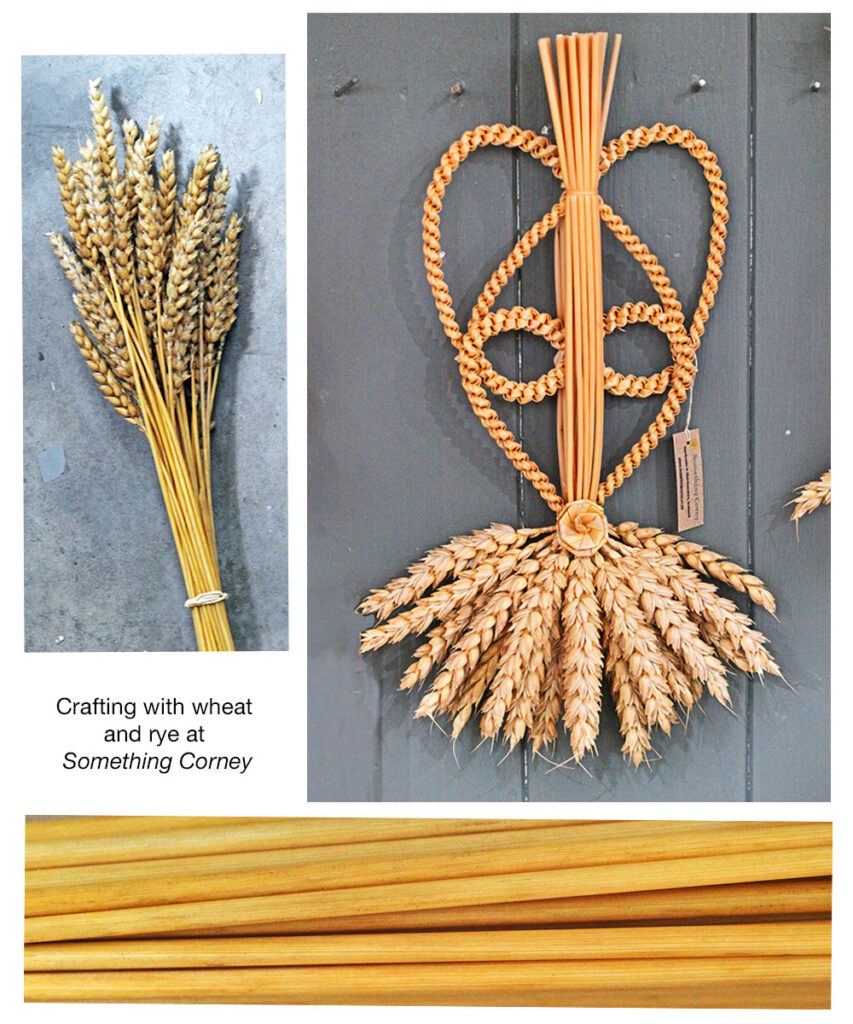
Long straw was once valued as a base for rope and string or used regularly in craftwork to make home decorations. Something Corny [5], based in Aberdeenshire, gave demonstrations and workshops through the day. The photos below shows some of their raw materials and a finished wall hanging.
Landrace wheat (left), a bundle of stems (lower) and an example of craftwork by Something Corny at the first Scottish Real Bread Festival.
Barley is rarely used in bread today but was once widely eaten in Scotland as a flatbread or bannock. Its use in food has been promoted by the Living Field for some years [6]. It’s a nutritious corn. And people from the Rowett Institute, Aberdeen were present to talk about their research on barley landraces in human health and nutrition [7].
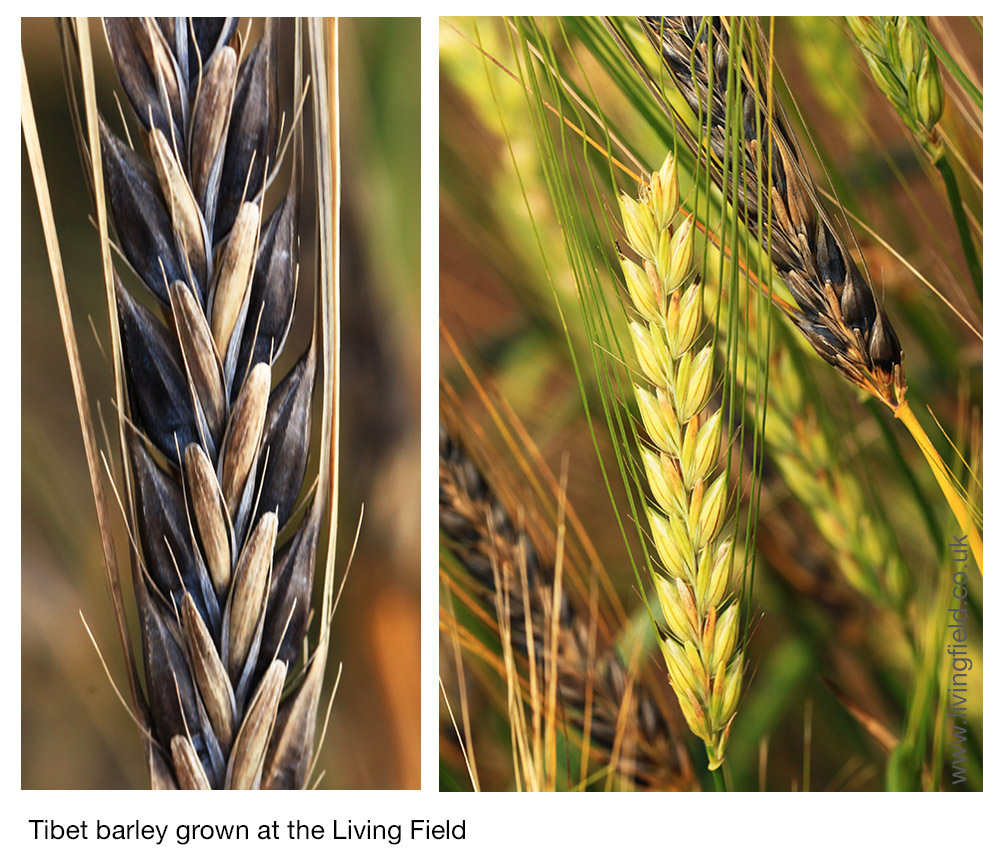
One of their posters described how a variety of barley from Tibet – a black barley – was being hybridised with other varieties and landraces at the James Hutton Institute. Tibet and its hybrids are high in fibre and miconutrients, and also in beta-glucan which may lower cholesterol.
Tibet barley in the Living Field Garden: ears are yellow-green at first then darken at maturity; and as in most landraces and unimproved varieties, Tibet’s ears do not mature all at the same time.
The organisers and hosts put on a great show, well attended and well appreciated. Here’s hoping that milling and baking with local wheat grows and thrives.
Links and further information
[1] Scotland the Bread: local grains, cereal landraces, milling for flour, baking, community, food, campaigning for healthy, nutritious bread.
[3] Bowhouse – Connecting you to your local produce – a venue in St Monans Fife.
[4] The heights of landrace wheat and modern wheat are compared on the Living Field’s Cereals page. Ed: it looks like the long stems in the photograph above were tied with old-style, orange baler twine – brings back memories of sunburn and sore backs from lifting those small rectangular bales before the big round ones became standard!
[5] Elaine Lindsay practices and teaches straw work at Something Corny based at Inverurie, Aberdeenshire – check the online workshops.