How dry was season 2022

Update on a previous post comparing spring and summer rainfall in dry years in east Scotland. By end August, 2022 was similar to other dry years but had fewer days without rain and some ‘wetter’ days with >10 mm. Conditions much worse in most of Europe where some annual crops suffered 20% loss.

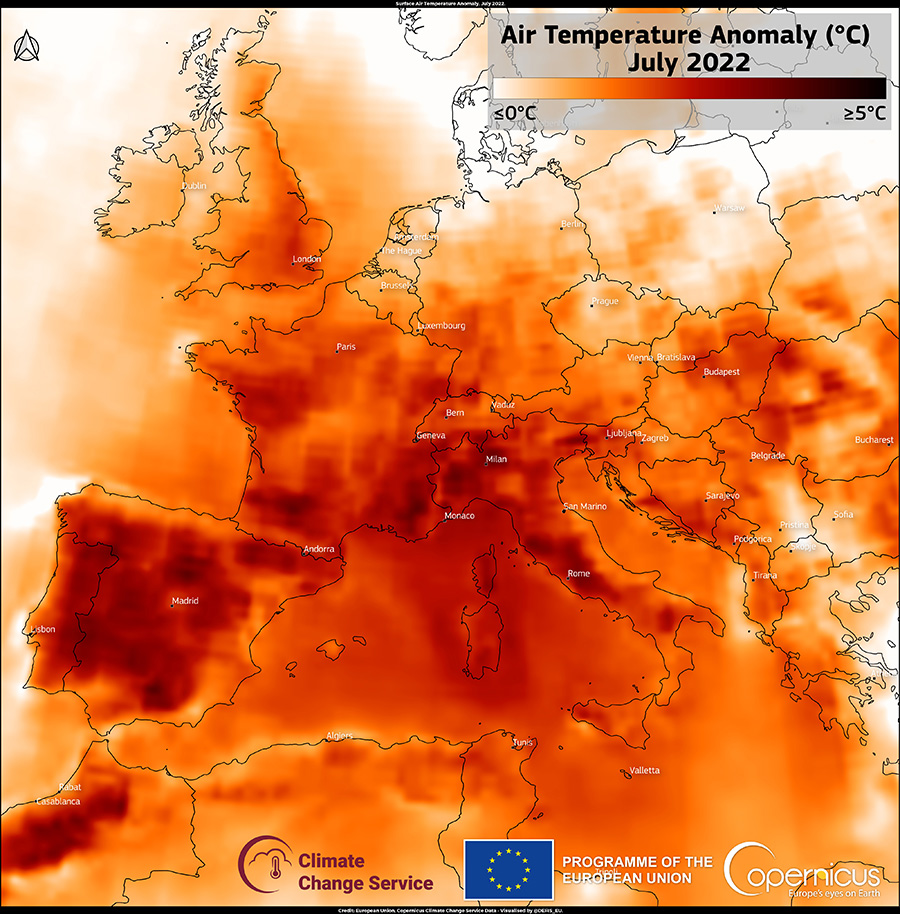
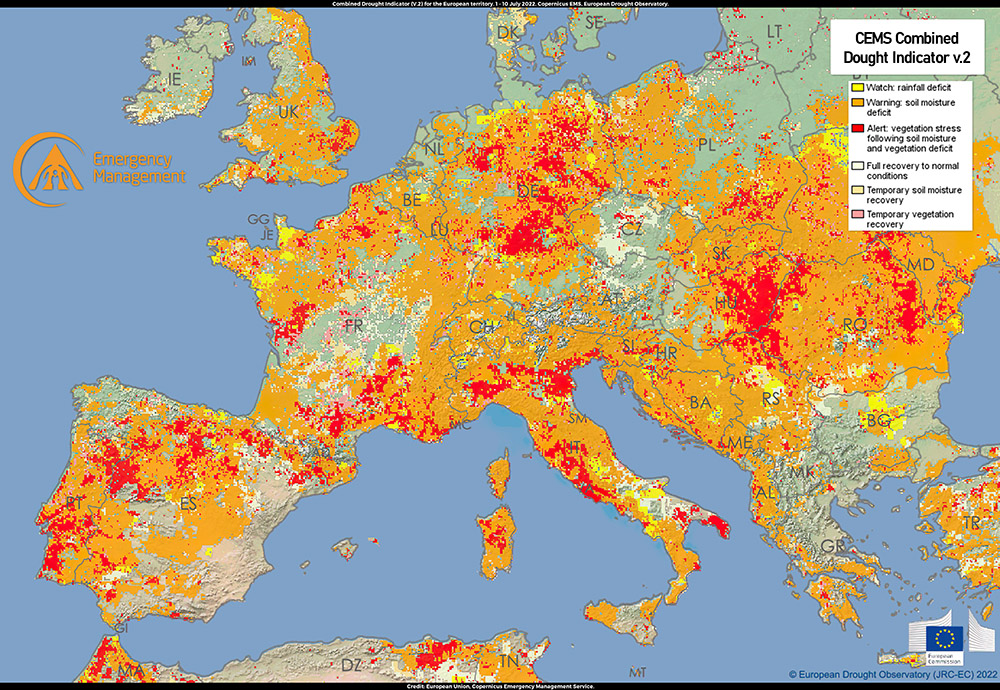
In summer 2022, most of Europe experienced exceptionally low rainfall. The Global Drought Observatory [1] reported some areas were already suffering in spring – for example, parts of south-eastern France, northern Italy, Hungary and Romania. By late summer, much of Europe, including some areas in southeast England, baked in severe heat and drought (Fig. 1). Conditions in east Scotland was less severe, but still very dry …. but how dry?

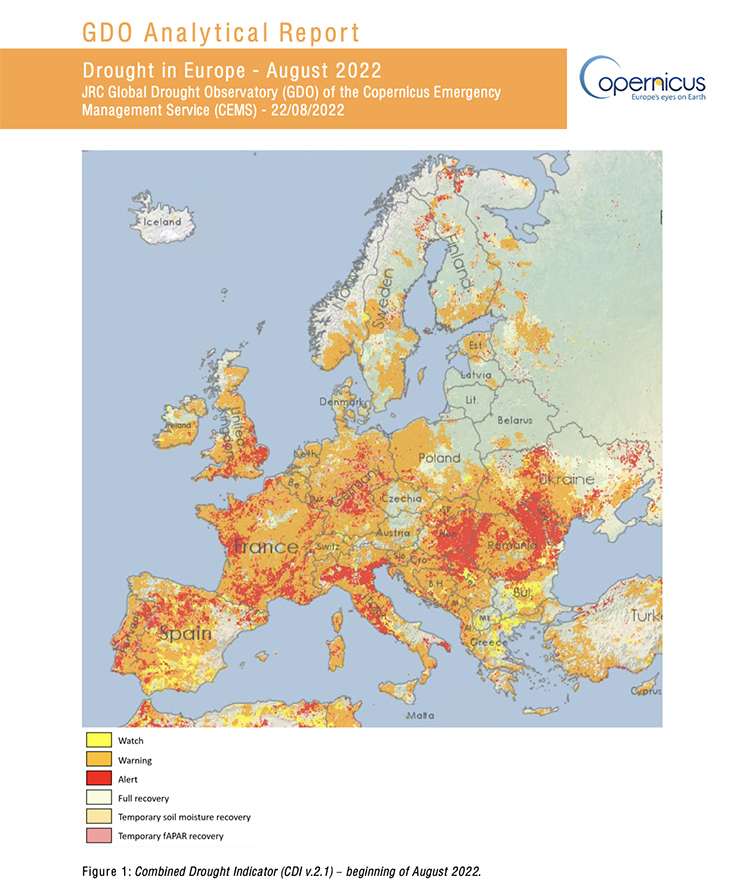
Fig. 1 From Drought in Europe August 2022 – Global Drought Observatory (GDO) Analytical Report, EU Copernicus Emergency Management Service [1]. Colours show the Combined Drought Indicator derived from several factors including weather, soil water and vegetation affected.

Summer 2022 in the croplands

The croplands here experienced one of the drier years of recent decades, but a previous Living Field post [2] showed that 2022 up to the end of July was no drier than other recent dry years such as 1955, 1976, 1984, 1995, 2003 and 2018.

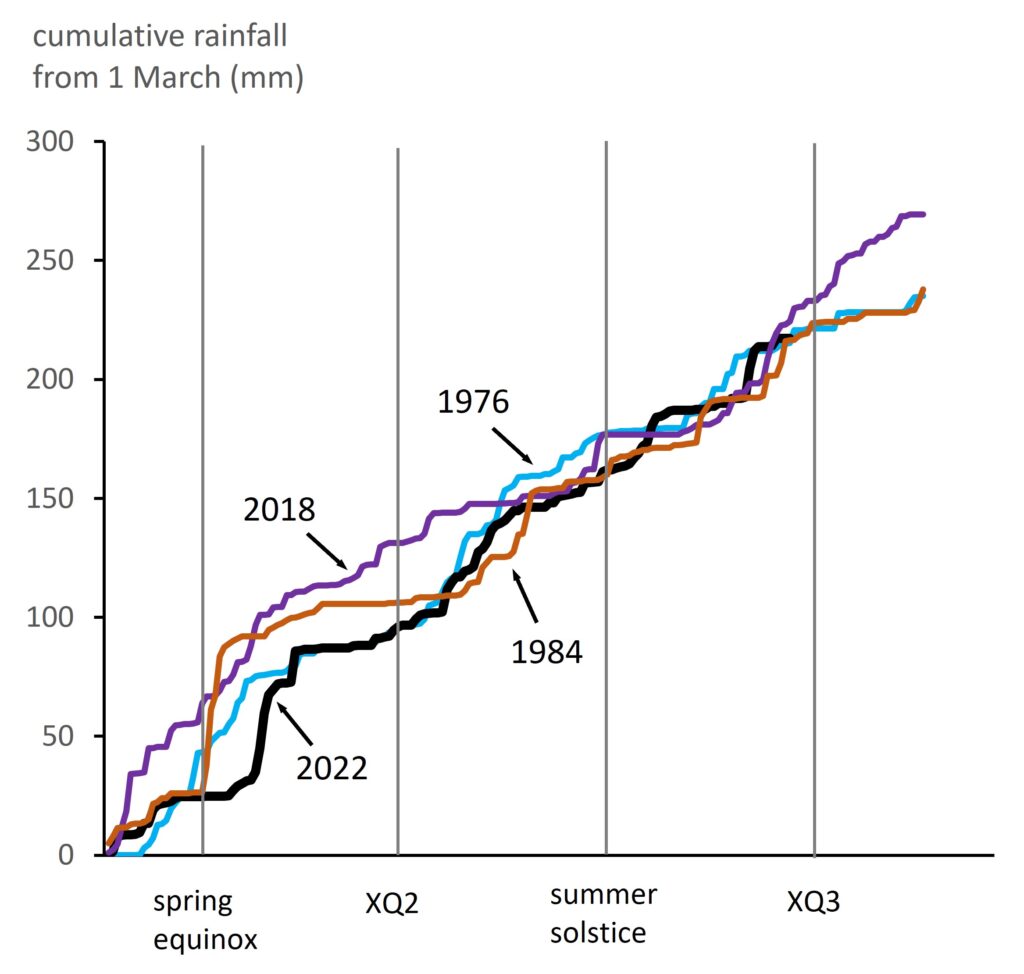
When the August records [3] are added, the position is much the same. The graph, Fig. 2, giving cumulative rainfall after 1 March, shows the years differ in cumulative rain mostly before the summer solstice (21 June) after which cumulative totals were similar. Spring and summer 2022 had similar rainfall to 2018, for example, and slightly more than 1976 and 1984. Some further rain in August raised the total to close to that for 2018 and a little above the figures for 1976 and 1984.

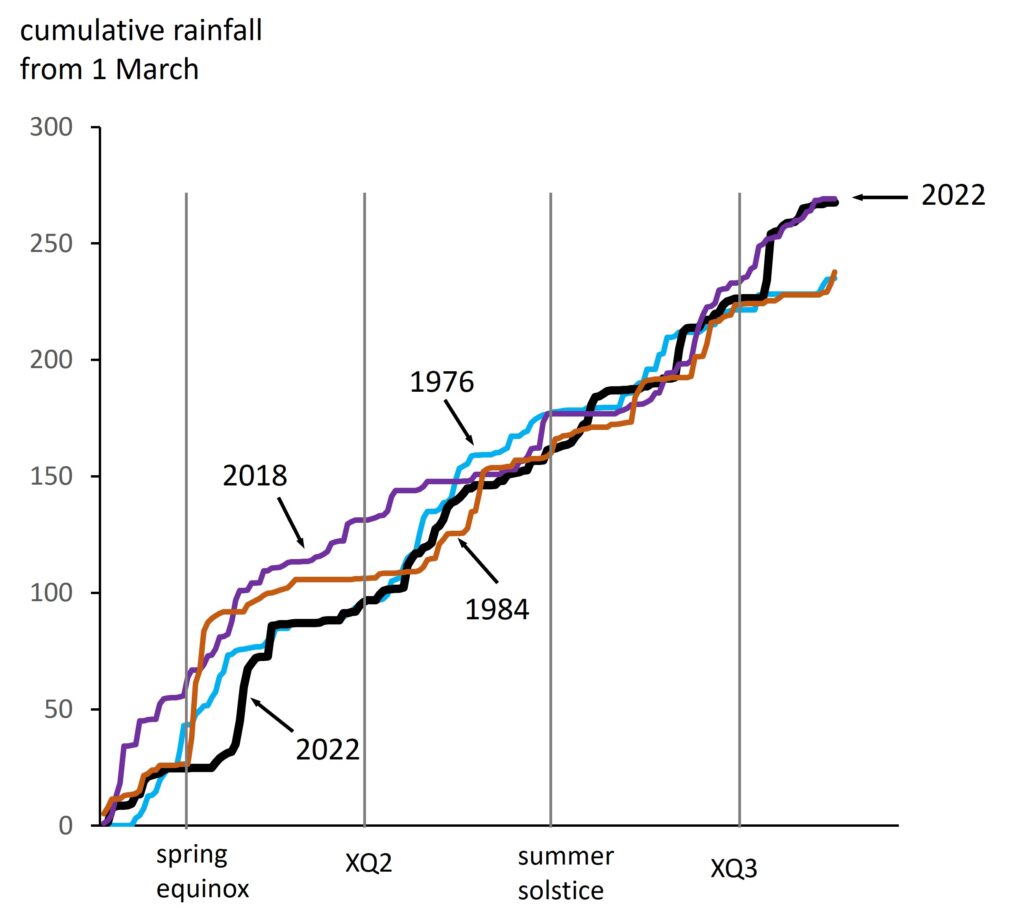
Fig. 2 Cumulative rainfall for the Met Office region East Scotland for 2022 compared to other dry years 1976, 1984 and 2018. Vertical lines show the spring equinox (21 March), the summer solstice (21 June) and two cross-quarter days (XQ2 in early May, XQ3 early August). Original data: Alexander and Jones [3].

Dry summers typically have many days with no rain or just a little rain. From analysis of regional data [3], 65-70% of days between 1 March and 31 August had < 1 mm rainfall in 1955, 1976, 1984, 1995, 2003, 2018 and 2022.

However, the distribution of rain in summer 2022 made it a little less dry than the other years. Only 20% of days had no rain. The other years had more, up to near 40% in 1955 and 1984. Also 2022 had several days with more than 10 mm of rain (Fig. 2).

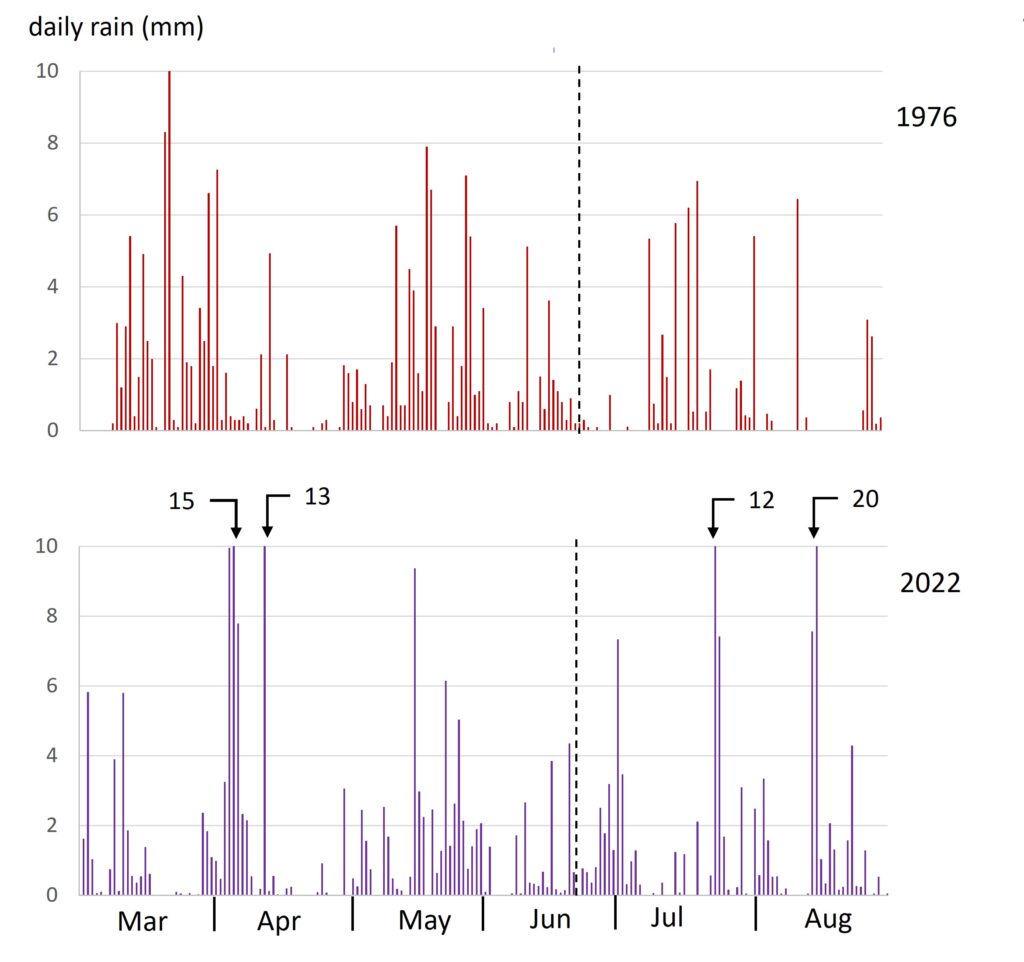
Fig. 2 Daily rainfall from 1 March to 31 August [3] in 2022 compared to 1976. All days in 1976 and all but 4 in 2022 had < 10 mm rainfall. Totals for the four days in 2022 are indicated. The vertical dashed line is at the summer solstice to allow reference to Fig. 1.

Did it affect crops and grass?

Well yes ….. but the links between rainfall and the yield of crops and grass depend on many other factors. Europe as a whole has been badly affected by lack of rain – but the continent covers such as range of climates, catchments, crops and pastures that no single conclusion can be applied to all.

The latest Bulletin on climate and crops from the Joint Research Centre [4] reports that some but not all crops have been reduced by drought. The yields of several major crops including grain maize, soybean and sunflower were reduced by 15-20% of the recent average, whereas yield of wheat went the other way – slightly greater than average. [Ed: some perennial crops may be more badly affected than grain crops – more on this in a later post]. 

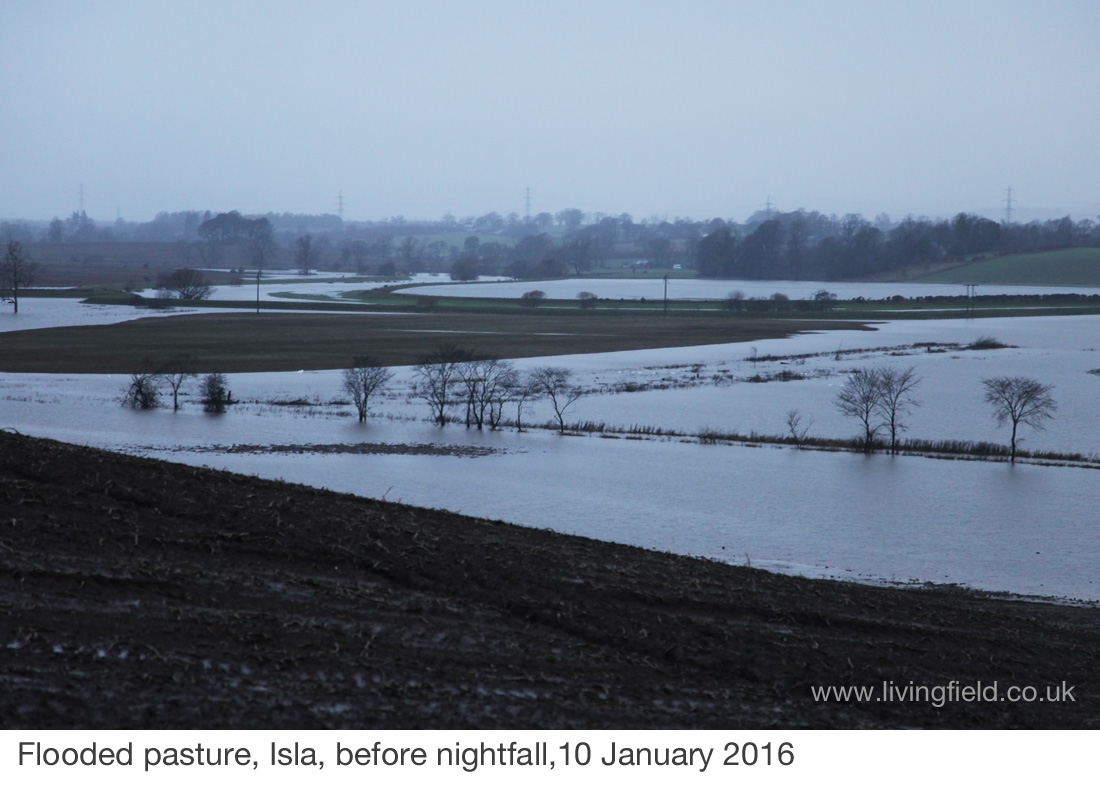
Pastures (on which livestock graze) have been losing ground cover over the summer due to drought but are now recovering in many areas. However, not all pastures have had yield reduced by drought. For example, a higher than average rain in Ireland prevented drought, but the associated cloud cover reduced solar income to the point where it limited the growth of grass.

Nearer home?

In most years, the soil is ‘full’ of water in March. Crops and pasture use that water as they grow, but – again in most years – the water depleted is repeatedly replenished by rain. In dry years, the store is not fully replenished and goes into deficit until the rain returns in autumn.

On days with little rain (e.g. < 2 mm), the water might just wet the foliage and soil surface before evaporating directly back to the atmosphere, so it does not replenish the store.

That’s why occasional days of higher rainfall may make a difference – they replenish the store. The graph for East Scotland in 2022 (Fig. 2) shows several days having 10-20 mm of rain, much of which would have penetrated the soil and provided the crops with a few more days of transpiration, and hence growth.

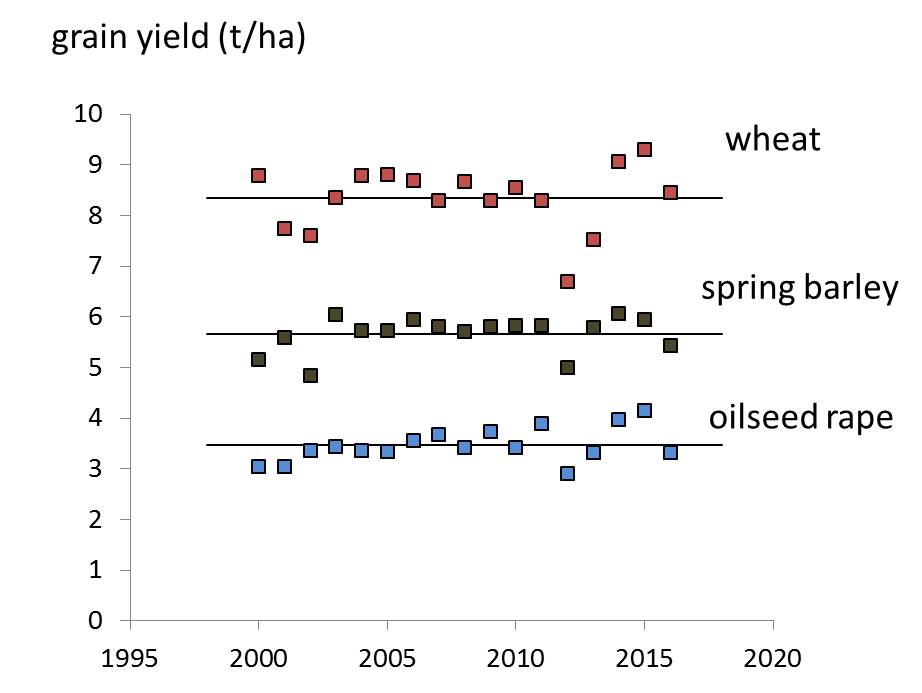
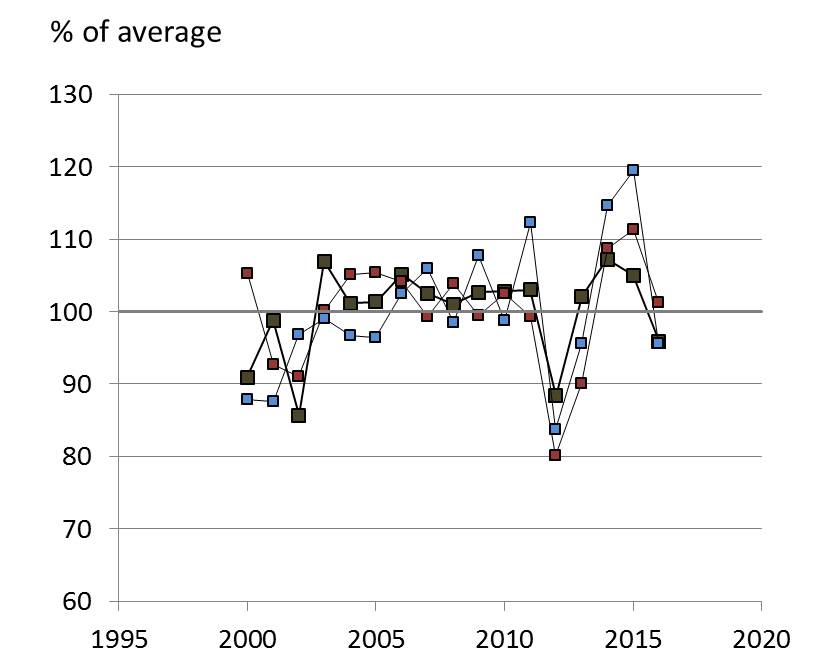
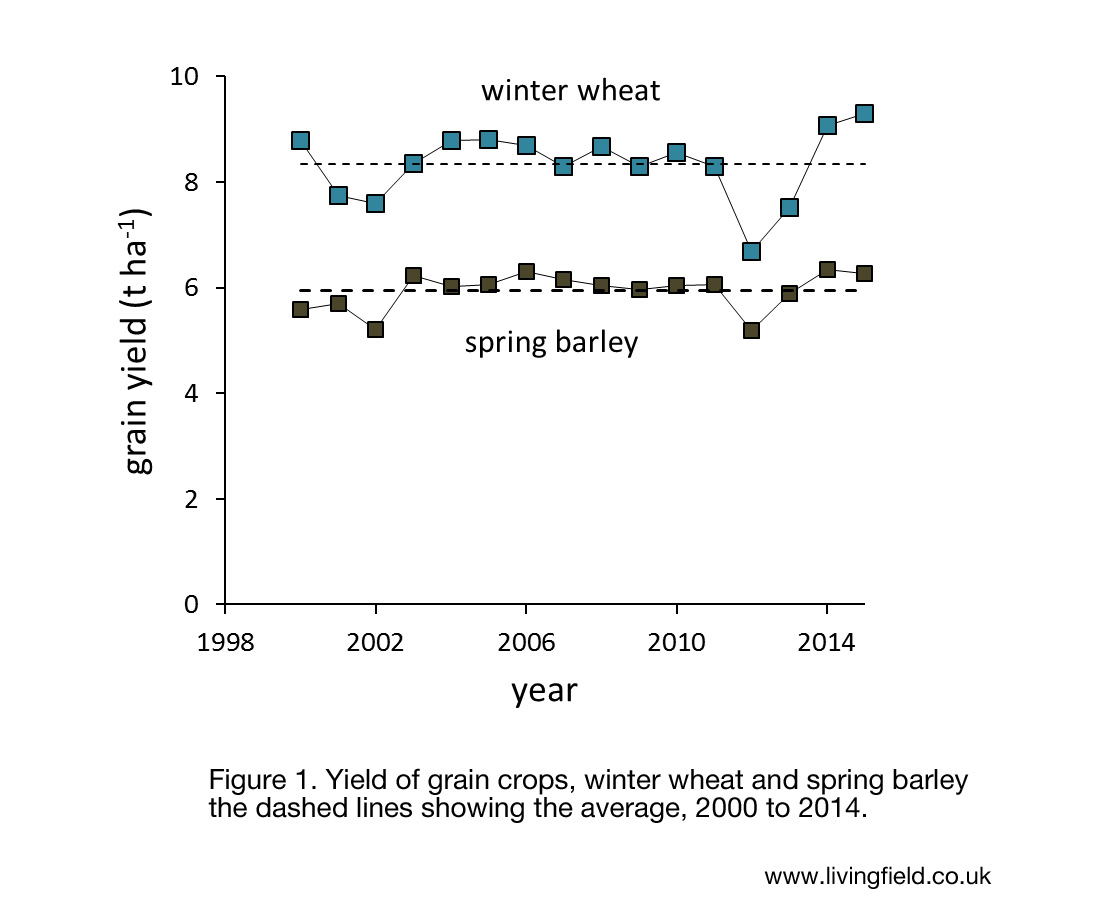
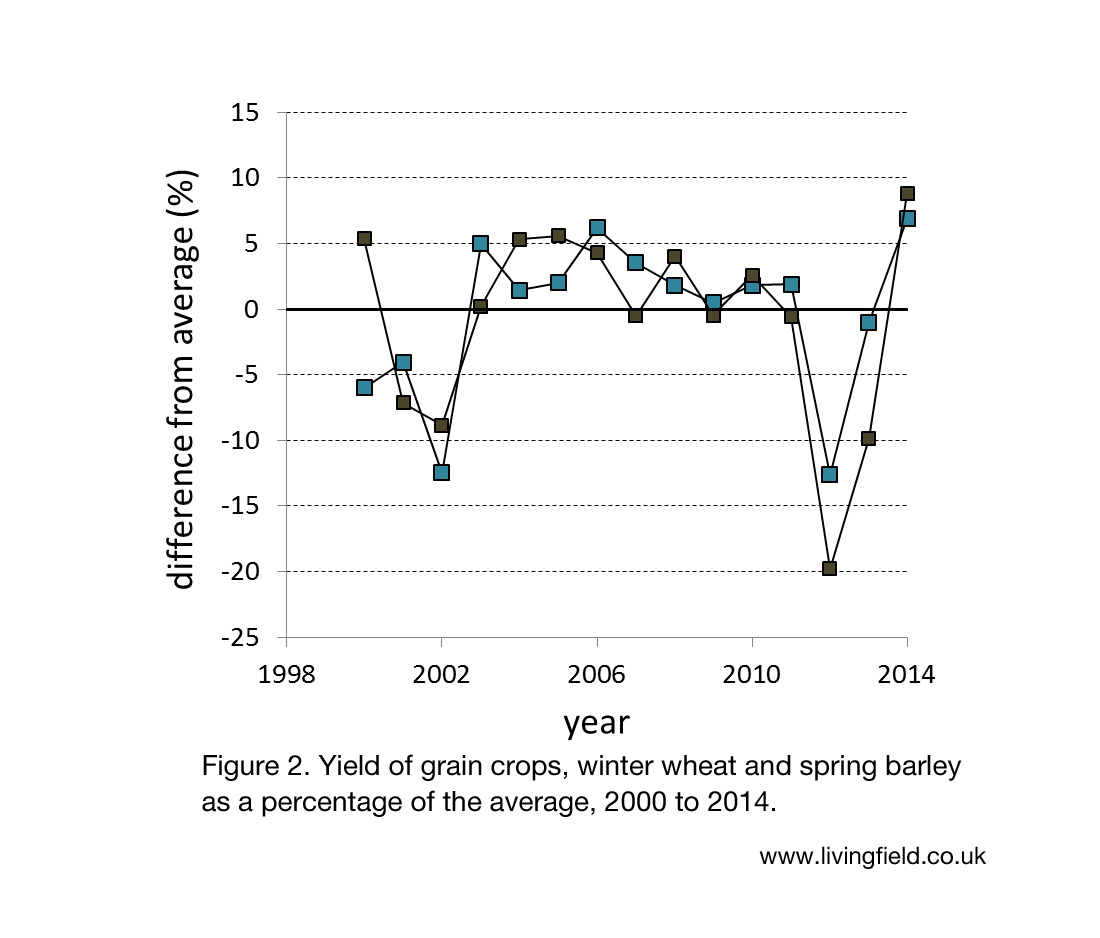
Was yield of the main crops here reduced by drought in 2022? It’s not possible to be certain without more computation based on crop cover, soil type and evaporative demand, but the provisional data from England [5] – there’s none yet for Scotland – show higher than average yield of cereals, consistent with the European JRC data cited above.

It will be instructive for future prediction of drought effects to work out how this increase in yield came about. Dry summers usually have several negative effects on growth of crops and pastures: high temperature shortens the period of growth; dryness of the soil and air reduces the rate of growth. But they can have positive effects – high temperature also allows crops to mature without loss due to wetting of the grain; and high solar income can increase the rate of growth.

If the provisional harvest data are correct, then – unexpectedly and contrary to the 1976 dry year – the positive effects outweighed the negatives.

There will be a further update when the figures for Scotland are published … but considering variation in rainfall over the past 80 years, the greater losses of agricultural output have been due to too much rather than too little rain.

Sources | Links

[1] Drought in Europe August 2022. Analytical report by the EC Global Drought Observatory, web link:

Toreti, A., Bavera, D., Acosta Navarro, J., Cammalleri, C., de Jager, A., Di Ciollo, C., Hrast Essenfelder, A., Maetens, W., Magni, D., Masante, D., Mazzeschi, M., Niemeyer, S., Spinoni, J., Drought in Europe August 2022, Publications Office of the European Union, doi:10.2760/264241

[2] On the Living Field web: 2022 Summer Drought

[3] Rainfall data used in Fig. 1 and Fig. 2 are from Met Office Hadley Centre UK Precipitation. Ref: Alexander LV, Jones PD. 2001. Updated precipitation series for the UK and discussion of recent extremes. Atmospheric Science Letters 1, doi:10.1006/asle.2001.0025. These figures are averages acrosss a region: there will be variation betwen local sites – some drier, others less so.

[4] Crop Monitoring in Europe October 2022. From the JRC MARS Bulletin (where JRC = Joint Research Centre of the EU, and MARS = Monitoring Agricultural Resources). One of a series of regular bulletins on climate and agriculture in Europe. Web link –

Baruth, B., Bassu, S., Ben Aoun, W., Biavetti, I., Bratu, M., Cerrani, I., Chemin, Y., Claverie, M., De Palma, P., Fumagalli, D., Manfron, G., Morel, J., Nisini Scacchiafichi, L., Panarello, L., Ronchetti, G., Seguini, L., Tarnavsky, E., Van Den Berg, M., Zajac, Z., Zucchini, A. and Rossi, M., JRC MARS Bulletin – Crop monitoring in Europe – October 2022 Vol. 30 No 10, Van Den Berg, M., Niemeyer, S. and Van Der Velde, M. editor(s), Publications Office of the European Union: doi:10.2760/23690.

[5] Provisional harvest figures for England, published 10 October 2022: Provisional cereal and oilseed production estimates.

Contact for this article: geoff.squire@hutton.ac.uk or geoff.squire@outlook.com

[Ed: article liable to editing ... up to 30 Nov 2022]

2022 summer drought

Low spring and summer rainfall 2022. Severe drought and fire risk over many areas of Europe including southern England. East Scotland rainfall lower than average but similar to 1976, 1984, 1995, 2003 and 2018. Implications for agricultural output and water supply.

Yes, Living Field country has been drier than average this spring and summer …. but not so hot and dry compared to much of continental Europe and England. First, the broader picture ….

EU Copernicus image of the day for 9 August 2022: data from Copernicus Climate Change Service [1].

Europe dry and burning

The map above, the EU Copernicus Image of the Day for 9 August 2022, shows the air temperature anomaly (difference from an average) for July 2022. The higher-than-average temperatures shown in shades of deep red are greatest in Spain and Portugal and parts of France and Italy, but the high temperatures extend to Britain and Ireland. Only parts of north Ireland and north and west Scotland were close to the average.

Prolonged dryness and heat increase the risk of fire in forest, moorland and scrub. The risk is now in the highest category in some parts of Europe as shown by the map below, released as the Copernicus image of the day for 19 July. The “numerous major wildfires (are) fueled by extreme heatwaves and pre-existing drought conditions. The total area burned in France, Spain and Portugal in the past 10 days exceeds 40,000 hectares.”

European Union, data from the European Forest Fire Information System (EFFIS), Copernicus image of the day 19 July 2022. Wester Europe ravaged by wildfires in 2022: shown in this visual based on data from Copernicus satellite imagery [1].

“The European Forest Fire Information System (EFFIS), one of the modules of the Copernicus Emergency Management Service, provides daily fire danger forecasts based on a Fire Weather Index (FWI). As shown in this image, the EFFIS FWI forecast for today, 19 July 2022, shows ‘Very Extreme Danger’ of fire – the highest level of risk on the ECMWF/FWI scale – in Spain, France, Italy and the United Kingdom.”

Drought

Prolonged lack of rainfall, high temperature and the associated high evaporative demand lead to shortage of water for people and agriculture. Drought conditions are particularly severe this year by the early and intense heatwaves that affected the continent at the beginning of Summer 2022.

“This visualisation (below) based on data from the European Drought Observatory (EDO) of the Copernicus Emergency Management Service (CEMS), shows the Combined Drought Indicator values during the first decade of July 2022. According to this data, 45 per cent of the European territory is in “Warning” conditions, while 13 per cent is in “Alert” conditions.”

The Combined Drought Indicator is derived from three measures based on remote sensing applied to known ground conditions: incoming rainfall, soil condition (including factors such as water holding capacity) and the vegetation’s ability to intercept and absorb incoming solar radiation (reduced if vegetation is stressed and scorched). The method and the significance of these warnings are explained in a report from the European Drought Observatory [2].

The presence of so much land under drought has reduced levels in the main rivers and reservoirs and will cause widespread yield reduction and in some areas total crop failure.

European Union, Data from the European Drought Observatory EDO of the Copernicus Emergency Management Service. Copernicus image of the day 27 July 2022 [1].

UK divided

In Britain, severe drought and high fire risk have developed mainly in parts of south and east England. Two of the maps above omit most of Scotland, so (we ask) what is happening in Living Field country, especially since water bans have just been issued for some areas?

Original map and commentary at Met Office web site: Driest July in England since 1935 [3]

The Met Office summary for July [3, map right] shows a major north-south gradient. Rainfall is slightly above average in the north and north-west of Scotland, as much as 50% below average in south-east Scotland and northern England but then decreasing to a severe 20% or lower in southern England.

There is more rain the the north than the south in most years but the variation in 2022 is extreme.

Rainfall in Scotland 2022

The Living Field earlier previously published rainfall data for Eastern Scotland comparing the dry 2018 with previous dry years based on daily rainfall records from the Had-UK series [4]. The following is an update as far as the end of July 2022.

Between 1 March and the end of July, the Eastern region had received about 200 mm of rain or half the 30-year average rainfall, but the Northern region was close to the average and the Southern (which includes all the south-west) not far off (Fig. 1). Compare these with the very low rainfall in the South-East England.

Fig. 1 Cumulative rainfall from 1 March 2022 for the Met Office regions of Eastern, Southern and Northern Scotland and South-east England. Original data: Met Office Hadley Centre UK Precipitation [4]. Vertical lines show the quarter and cross-quarter days.

The rainfall in South-east England was very low after the summer solstice – that’s from the third week of June – which is also the time of highest annual temperature and evaporative demand. And it is also often the time of highest human demand.

The effects of the drought on agriculture will depend on the timing as well as the amount of the rainfall. The graph below (Fig. 2) compares 2022 with dry summers in 1976, 1984 and 2018. The years differ mainly in the timing of rainfall between the spring equinox on 21 March and the second cross quarter day (XQ2) in early May.

By the summer solstice (21 June) the totals received were similar, between 150 and 200 mm and remained similar up to the third cross quarter day (XQ3) in early August. Other dry years such as 1995 and 2003 were also similar to those shown.

Fig. 2 Cumulative rainfall from 1 March for the Met Office region East Scotland in dry years 2022 (heavy black line), 2018 (purple), 1984 (red) and 1976 (light blue). Original data: Met Office Hadley Centre UK precipitation [4]. Vertical lines show the quarter- and cross-quarter days.

Effect on agriculture

The severity of drought and heat in southern England and much of mainland Europe will certainly depress yields of many crops. It’s already evident that olive oil will suffer serious losses in much of Spain for example.

The extent of yield loss in the wheat-growing areas of England will not be confirmed until harvest records are complete. The drought is so widespread however that crop production will suffer across the EU and well beyond, adding to the pressures due to reduced exports from Ukraine.

Scotland’s arable and grassland is likely to be much less affected than many other regions. The dry summers of 2018, 2003, 1995 for example caused little reduction in grain yield. The croplands here have been more severely affected by excess rainfall, as in the wet 2012.

Based on previous experience, the pattern of accumulated rainfall this year should not cause a major depression of cereal yield (barley, wheat and oats). The soil received a reasonable amount of rainfall up to the second cross-quarter day in early May (XQ2) . A crucial time for crop growth is between XQ2 and the solstice when crops and grass are either bulking (if overwintered) or forming their leaf and root systems.

Provided the cereals in lowland Scotland have formed their root system, and can set and start filling grain within a few weeks after the solstice, then low rainfall in later July and August will cause relatively little suppression because the roots will be exploring deep in the soil and the grain is maturing and drying.

In contrast, crops such as potato and vegetables that consist of a large percentage of water at harvest will suffer more. In dry summers, these high-value crops are typically irrigated up to harvest but abstraction – the removal of water from rivers and groundwater – is likely to be regulated this year.

Effect on water supply and aquatic ecosystems

By early August, the Scottish Environment Protection Agency (SEPA) reported that water supply in areas of north Fife had moved into the highest category of Significant Scarcity, while most catchments to the east were at Moderate Scarcity [5]. At Significant Scarcity SEPA has the power to temporarily stop abstraction, for irrigation and use by industry, for example. Domestic water supplies are unlikely to be affected since reservoirs in the east of Scotland are still above 70% capacity.

In the UK more widely, the current heat, drought and increased demand for water puts added pressure on a water supply system run by a private sector that many consider to be seriously failing due to water leakages (up to a quarter of stocks) and discharge of raw sewage to rivers [6]. The experience of 2022, especially in the south, should make people realise how fortunate we are to have water on tap in most years.

Human activity takes water from major stores such as reservoirs, from rivers and other surface water bodies and from groundwater through boreholes. From all sources, but particularly from surface water, extraction during drought harms wildlife. Water bodies dry up, connectivity along river systems is broken, food supplies dwindle. It seems too often that wildlife and habitat are down the list of priorities for water.

Sources | links

[1] The EU Copernicus web site provides an Image of the day from which the three maps above were taken. The following links lead directly to the pages for 9 August, 27 July and 19 July. More at the Copernicus Climate Change Service.

[2] Report from the European Drought Observatory: Drought in Europe – July 2022. See also the JRC MARS Bulletin, June 2022 – Crop Monitoring in Europe.

[3] The Met Office web site offers weather summaries, warnings and comment on 2022 and several downloadable time series, e.g. Driest July in England since 1935.

[4] Rainfall data downloaded from Met Office Hadley Centre UK Precipitation – HadUKP Data Download. Ref: Alexander LV, Jones PD. 2001 Updated precipitation series for the UK and discussion of recent extremes. Atmospheric Science Letters doi:10.1006/asle.2001.0025. For earlier posts on the Living Field site: Resilience to the 2018 drought.

[5] Scottish Environment Protection Agency (SEPA) – Water Scarcity Report 5 August 2022.

[6] Environment Agency, 18 July 2022: Water company environmental performance performance hits new low. Ofwat is the water regulator for England and Wales: see for example, 9 March 2022 – Five water companies targeted. The Times 6 August 2022 published an article by Robert Lea – Regulator’s patience with water firms is drying up (digital access free for one month)..

Effect on corn yields of the 2016 winter flood

High annual rainfall in recent decades causing problems for cereal production; timing of rainfall more important than yearly total; much greater yield drop caused by the wet harvest of 2012 than the winter floods of 2016. [An article in the series ‘Winter flood’.]

The last few decades have experienced several of the highest rainfall years since reliable records began in 1910. The effects of perhaps too much water on long term trends in crop yield are being examined and will be reported elsewhere.  Yet contrasting years tell us already that problems are not caused by the amount of rainfall in a year, but by the timing of that rainfall.

lf_nm_1701_wntrfldcrs_gs_1100

The image above looks south over the Carse of Gowrie in early January 2016, the green cereal (corn) fields and the brown stubble were completely waterlogged, the landscape immersed in dense cloud, hardly any light for photosynthesis in the middle afternoon. (No attempt to brighten the image – this was how it looked.)

Many autumn-sown corn fields grew yellow with the persistent wet, dead patches within them. Yet the final estimates of yield for the harvest years 2016, released in December 2016, give the first indication that the severe flooding the previous winter caused a much smaller loss of yield than the wet harvest of 2012.

lf_ntsmgs_1701_wntfldyld_gs_750

Fig. 1. Grain yield, average for Scotland, for wheat, spring barley and oilseed rape between 2000 and 2016: the first two standardised to 14% water content, the latter to 9%; horizontal lines show the average.

The trace in yield from 2000 (Fig. 1) shows a drop in 2002 for the two cereal crops, then a period of stability up to 2011 followed by a large fall in 2012. Yield partly recovered in 2013, rose well above the average in 2014 and 2015, then dropped back in 2016.

The same data are shown in Fig. 2 where yield of each crop is expressed as a percentage of the average for the whole period (100% line). The large depression in 2012 and 2013 is shown by all three crops as is the recovery and the later drop in 2016. The 2012 depression caused economic losses, but perhaps more important, the large variation between years shows how sensitive modern arable farming is to these slight variations in the weather.

lf_nm_1701_wntrfldyld_gs_750

Fig. 2. Grain yield from Fig. 1 presented as a percentage of the average for the period, for wheat (red), spring barley (green) and oilseed rape (blue).

It’s not the total rainfall

The annual  rainfall exceeded 1300 mm several times during the period of stable yield between 2003 and 2011, but then the rain generally peaked in the winter. Only about one third of the corn is in the ground at that time (mainly winter wheat, winter barley and winter oat) – the larger area destined for spring-sown barley is still unplanted.

So provided the winter crops are not submerged for more than a few days at a time, they recover and grow to harvest. This happened during the stable phase, for example in 2008 and 2009 when annual rainfall was above 1300 mm.

Why was 2012 yield so poor?

The difference in 2012 and to some degree in 2002 was that rainfall was much higher in summer before and during harvest. In fact, annual rainfall in 2012, at 1287 mm, was lower than that during several years between 2003 and 2011.

It was the wet weather in late summer and autumn of 2012 that caused major loss of yield in the harvest of that year (mostly August to late September). The damage to the ground and to the winter crops just sown or about to be also caused a depression of yield in the next harvest in late summer 2013.

How did 2016 recover?

In contrast, the high rainfall in the winter of 2015/16 set records: in East Scotland December 2015 had the highest rainfall at 272 mm since records began in 1910, then January 2016 also broke all previous records with 266 mm.  The result was prolonged waterlogging of fields and severe flooding of some river floodplains, and as stated above, a yellowing of leaf in many winter cereal fields.

Then conditions changed – the spring and summer months had less than average rain, and more than average sun, allowing soils to dry and crops to bulk, such that they yielded at or not much below the the average in Fig. 2.

lf_nm_1701_wntrfldsl_gs_1100

The image above looks north across the Isla floodplain in Strathmore, in dense cloud just before nightfall, the field in the foreground cultivated, sludging and eroding into the river-water. (No attempt to brighten the image.)

Resilience?

The 2015/16 cropping season was testament to the resilience of the crop varieties and their agronomic management to overcome what was unusual weather by our standards. There’s also evidence that farming adapted, perhaps learning from the 2012 floods to shift its cropping patterns and perhaps the fields in which its most profitable crops were placed.

Winter wheat maintained its area between 2015 and 2016, indicating that few fields already sown with this crop had failed by February 2016 to the extent that they had to be resown in March or April with another crop.

But the surprise was the greater production of oats despite the bad winter. The area sown with oat (mainly spring 2016) increased a little, but the yield per unit area increased from 5.92 to a record 6.44 t/ha (tonnes per hectare) and the total production of oat increased by a factor of 1.32, also to a record for recent decades.

So what was going on? The reasons why oats did so well are not clear at present.

Signs of things to come?

The capacity of grain yield to recover from the late summer rain of 2012 and adapt to the winter floods of 2016 shows the soil and crops have kept a certain resilience during this bout of record rain-years.

But the alarming feature of the traces in Fig. 1 and Fig. 2 is the large variation between years caused by what were – compared to weather patterns elsewhere – fairly small shifts in the distribution of rainfall through the year.

The longer term effects of the present rise in annual rainfall are not yet understood. It will be not easy to distinguish the effects of rainfall from the higher temperatures over the same period – and the lower solar income in cloudy summers

More on this in future articles …

Sources, references

Links on this site

Winter flood – pages on the flooding effect of the high rainfall in recent years.

Winter flood …. continued  – commentary on the 2012 yield depression

The late autumn floods of 2012 – after the bad harvest

Rainfall

Rainfall since 1910 for UK and regions. Annual and monthly totals are available from 1910 at the Met Office pages for UK and Regional Series. At the Download site for UK and regional datasets scroll down to ‘Year ordered statistics’ and click the download link for ‘Scotland E – Rainfall’.

Winter rainfall 2015/2016. The following Met Office web article gives a summary, with maps, videos and data, of the very wet November to January: Further rainfall and flooding across north of the UK. http://www.metoffice.gov.uk/climate/uk/interesting/december2015_further Jan 27 2016

Cereal and oilseed yields

Scottish Government. Final estimate of cereal and oilseed rape harvest 2016. Downloads are available as pdf and excel files. In the excel download, Tables 2 and 3 give cereal and oilseed rape areas, yield per hectare and total production from 1997 to 2016.

Yields, take from government statistics, are given in tonnes per hectare, t/ha, standardised to a water content of 14% for the cereals (corn) and 9% for the oilseed. Standardising is needed because the grain might be a bit drier in some harvests and a bit wetter in others.

Contact: geoff.squire@hutton.ac.uk

Winter flood … continued

The floods this past winter of 2015/16 were spectacular, lakes appearing where there were fields and swollen rivers coursing through the landscape. The soil was saturated for months and crops were damaged.

It was difficult to predict at the time the loss of grain yield at harvest. If a winter crop fails, farmers may switch to another crop such as the hardier oat. Or they may sow oat in spring instead of spring barley; or even not sow a grain crop at all. Only the ‘good’ crops might appear in the census. The trouble caused by the flooding might appear less than it was.

The first reliable indication is after harvest when the first estimates of the year’s yield are tabled. In 2016, the first estimates were published on 6 October and they suggested a smaller drop in yield than perhaps expected, smaller than the one following the floods in 2012.  But we’ll wait until the final estimates are out in December 2016 before making final comparisons with that year.

lf_wf_flud12_yldbslt_2000-14_gs

Here for reference (Figure 1) is a graph of national average yields each year from 2000 for the main grain crops, spring barley and winter wheat. In Figure 1, yield in units of tonnes per hectare  (weight of grain per hectare of land, a hectare being 100×100 m) is shown in comparison with the average over the period represented by the dashed lines. Winter wheat yields more than spring barley, but the drop in 2012 is clear for both.

lf_wf_flud12_yld%_2000-14_gs

In Figure 2, the yields are shown as a percentage of the average (the heavier line at ‘0’ on the vertical axis). Both crops go up about the same and down about the same each year, but the drop in 2012 was bigger than anything like this in the last two decades. The wet cloudy year of 2002 also showed a fall in yield. Compare these with high yield of 2014 when the warm, sunny summer allowed the grain to bulk to a record for recent times.

Despite all the advances in machinery and crop varieties, farming in the north east Atlantic croplands is still very much at the mercy of the weather. Maintaining soil is good condition will be essential for future yields.

Further information and photographs of the 2012 floods on the Living Field web site at The late autumn floods of 2012.

Sources

First Estimate of the Cereal and Oilseed Rape Harvest 2016. Scottish Government. Published 6 October 2016. Link to a downloadable PDF file.