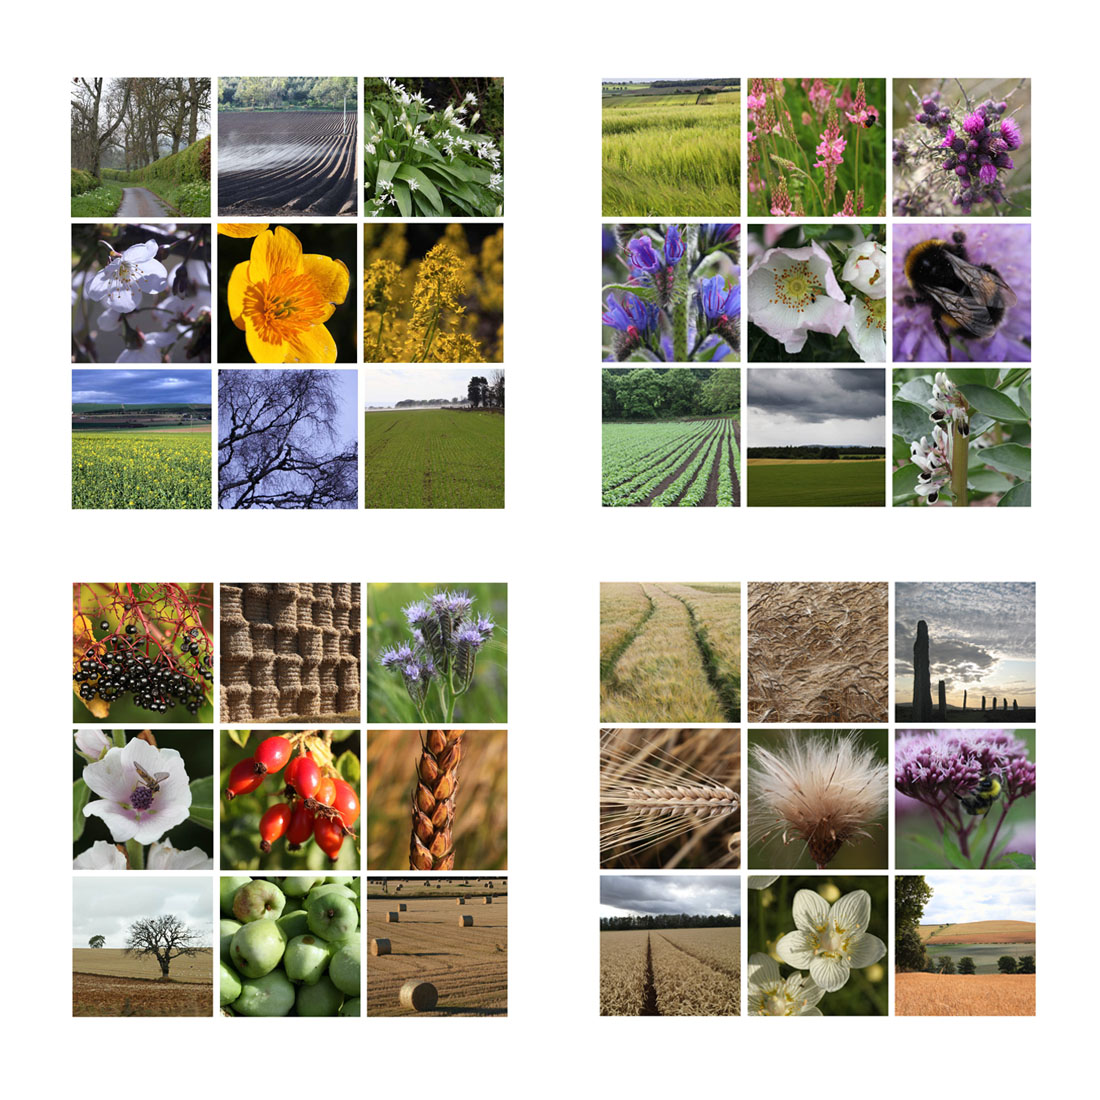
The Living Field garden, in its own small space, shows how plants and people adapt to the seasons in the surrounding cropland. The local plants tend to be tuned to the seasons, but the crops always seem to be a bit out of phase. Why is this?
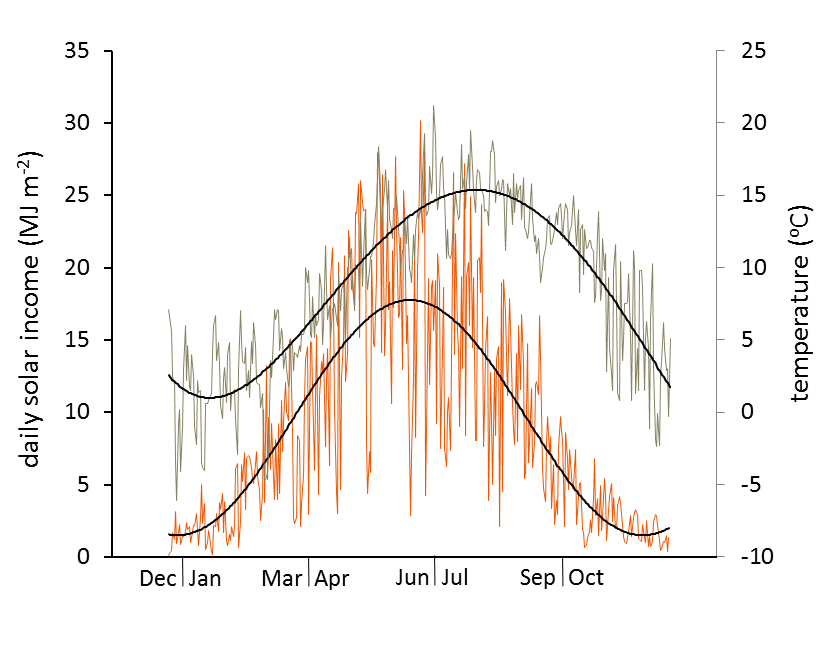
A defining feature of latitudes 55 to 60 degrees north in Atlantic north-west Europe is that the annual cycle of temperature lags well behind the annual cycle of solar income. The earth cools down in winter then takes time to heat up in the spring. By early autumn it’s still warm but the solar income is falling day on day. (See graphs lower down for examples.)
The ‘tension’ between the cycles of temperature and solar income came to be understood thousands of years ago by the first migrant farmers to cultivate fields here. Modern farming, with its machines, agrochemicals and advanced crop varieties, can’t avoid this tension. If farming gets it right, then the corn yields are the highest in the UK. If not, there can be heavy losses.

Images above, top left clockwise: XQ2 May, summer solstice, XQ3 August, autumn equinox.
Marking the seasons
The quarter days – the summer and winter solstices and the spring and autumn equinoxes mark the cycle of solar income (see Energy and light: no life without the sun), but at these northern latitudes, the cross quarter days (in early February, May, August and November) are a better guide to the yearly temperature cycle and much of agricultural activity.
Here we look at the year in the croplands through these quarter days and cross quarter days. We begin with sets of nine photographs (examples above), each first posted under Notes Images, then described in more detail on pages accessible from the links below or in the right hand menu.
- Winter solstice
- XQ1 February
- Spring equinox
- XQ2 May
- Summer solstice
- XQ3 August
- Autumn equinox
- XQ4 November
The sun’s energy and the earth’s temperature
And for each quarter day and cross-quarter day, the solar cycle and the temperature cycle take their positions, and no matter what the year’s weather brings, no matter what the north-Atlantic sends us, these positions are much the same from year to year – the temperature cycle lagging about 6 weeks behind the solar.
The graph below compares, day by day, solar income (red) and temperature (brown-grey) during a year, starting at the winter solstice to the left and progressing through the summer solstice in the middle and back to the next winter solstice to the right. For each of solar income and temperature, the variation even over a few days is enormous, and this is typical of the north-east Atlantic Maritime region (three seasons in a day, four in a week!). Yet despite the variation, there is a strong annual cycle shown by the fitted curves (the black lines), which are a sort-of-average-trend through the variation.

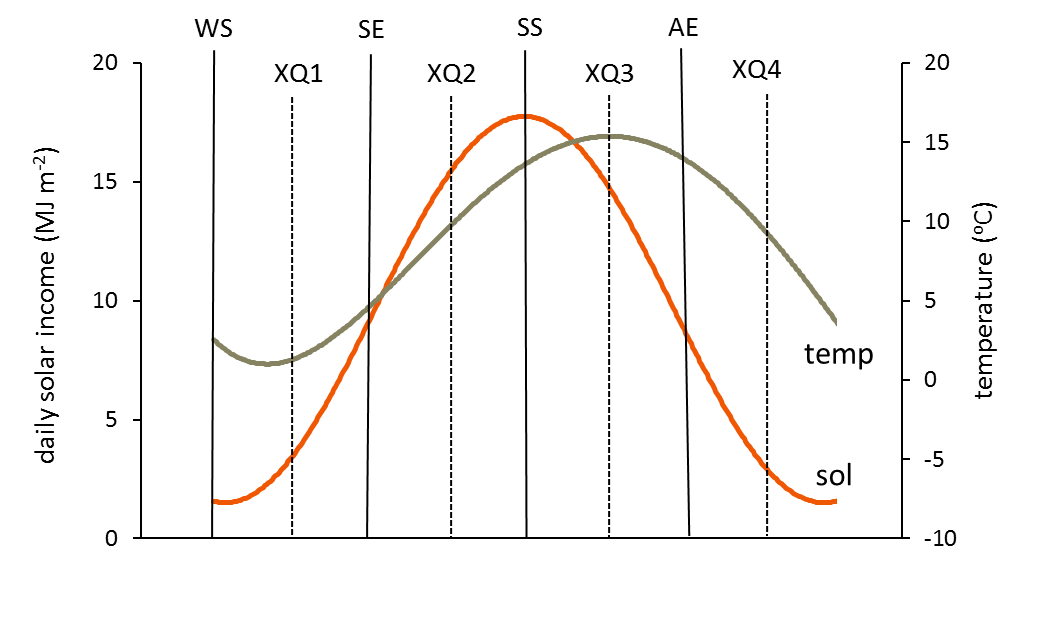
So where do the quarter days and cross-quarter days fit into these cycles? The graph below simplifies the upper figure by omitting the day to day variation and showing just the fitted lines – red for the solar cycle (sol) and in brown-grey for the temperature cycle (temp).
The solar curve (defining the quarter days) is almost symmetrical, the upward part mirroring the downward. But the temperature curve is offset to the right, and this is the cause of the ‘tension’ referred to above.

The progression through a year of solar income (red, left-hand vertical axis) and temperature (grey-brown, right-hand vertical axis) in relation to the quarter days (WS, winter solstice: SE, spring equinox; SS, summer solstice; AE, autumn equinox) and the four cross-quarter days, XQ1-4 (Squire/Living Field)
The ‘sol’ curve (red) is lowest at the winter solstice (WS) and highest at the summer solstice (SS). The spring equinox, when days and nights are equal in length (SE), is about half way between WS and SS, while the autumn equinox is half way between the SS and the next WS (not shown).
The ‘temp’ curve (grey-brown) is lowest at the February cross-quarter day (XQ1) and highest at the August one (XQ3). The other cross quarter days are the temperature-equivalents of the spring equinox (XQ2) and autumn equinox (XQ4). As will be seen in the descriptions for each of the quarter and cross-quarter days, the annual cycle of cropping is aligned more with the cross-quarter days.
Light and dark
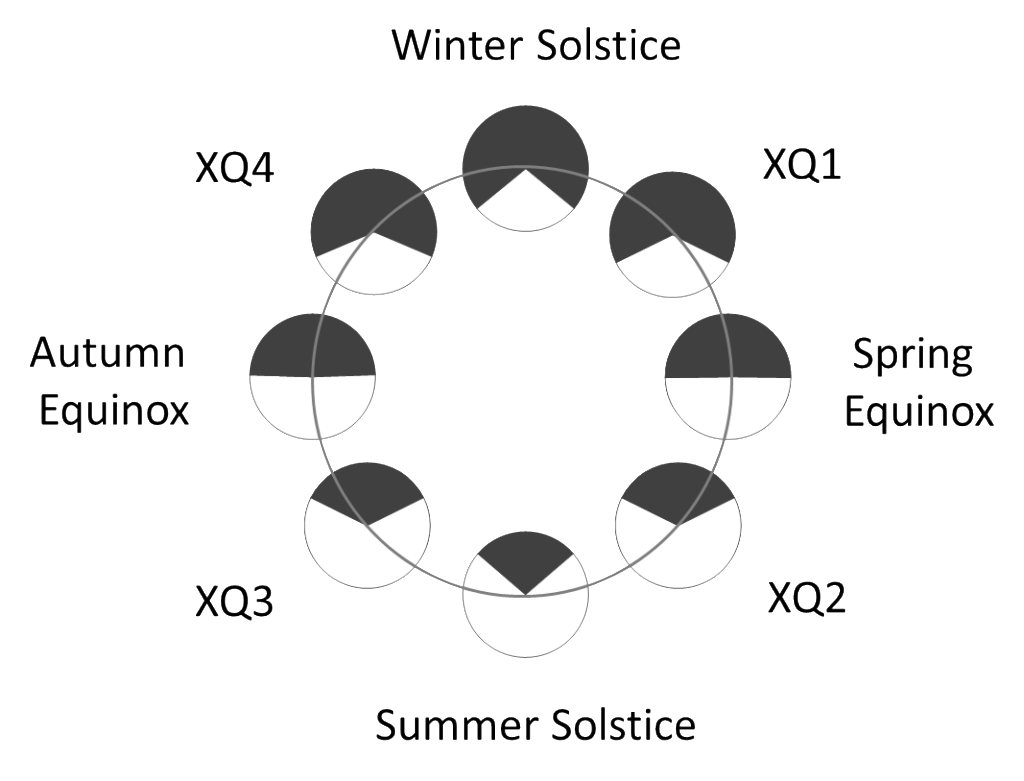
The year’s cycle is represented in the diagram below by the length of night and day at each of the quarter days and cross-quarter days. The diagram is reproduced on each of The Year’s pages.

Sunrise and sunset values at each time were taken from interactive databases at the US Naval Observatory at the Naval Oceanography Portal. For more information, including links to these databases and ways to find your latitude and longitude, see Energy and light: no life without the sun.
So if many of the ancient festivals and feast-days are aligned with the cross-quarter days, is this chance or is it something to do with the special significance of the cross quarter days to agriculture …
Art, literature and the tradition
For each quarter day and cross-quarter day, The Year is introducing a selection of art, craft, festivals, songs and tunes from the tradition made, written for or performed around the time of year. Among recurring sources are –
- Labours of the Months – a medieval theme widespread in Europe and preserved at St Agatha’s Church, Easby, Yorkshire. See article on this site: Labours of the Months.
- The Farmer’s Year by Clare Leighton – a collection of writing and engravings, one for each month in the English farming calendar (1933). New edition by Little Toller Books, Dorset.
- Frost and Fire by the Watersons – a classic album (vinyl, CD) of seasonal songs from the tradition (1965). Topic Records: CD reissue.
- Mid Winter – a celebration of the folk music and traditions of Christmas and the Turning of the Year. Information at the Free Reed web site – 4 CDs (comprehensive anthology of singing and playing traditions from all parts of Britain.
- Further info on Midwinter singing and traditions at the the page for Winter Solstice.
[ Page last updated 30 December 2023 ….. ]
