
There is no simple or direct link between climate and food security. Each of the weather-variables affects many processes in soils, plants and animals. Yet there are some general principles linking climate and crops that can be applied to understand present limits and to devise a path to future resilience.
This and the next article look at some of these ‘backroom’ processes. Solar radiation is the energy or ‘fuel’ that drives the growth of plants and their dependent livestock. If a dry spring lowers cereal yield, it does so by reducing leaf cover and hence the solar radiation captured by the plants. In a year bearing high yield, crops will have full cover by early May and capitalise on the high solar income through to August .
[Return to Climate and crops]
Summary
- Incident, reflected, transmitted and absorbed solar radiation briefly defined.
- Growth and yield of vegetation expressed through Intercepted radiation (incident minus transmitted) and ‘radiation use efficiency’.
- Intercepted radiation primarily determines differences in growth among species, climates and production systems.
Solar radiation in crops, grass and trees
Plant canopies are far from simple structures. They consist of many shoots, leaves and branches arranged in complex 3-D shapes – but they can generally be simplified into a ‘big leaf’ to allow comparison of vegetation in different climates and growing-systems [1].
The first step in any analysis is to work out how much of the solar radiation is intercepted and transmitted by the plant canopy. Instruments called solarimeters [2] are used to measure incoming solar immediately above the canopy (I in Fig. 1), that reflected from the plant canopy (R), and that passing through or transmitted (T) to the soil.
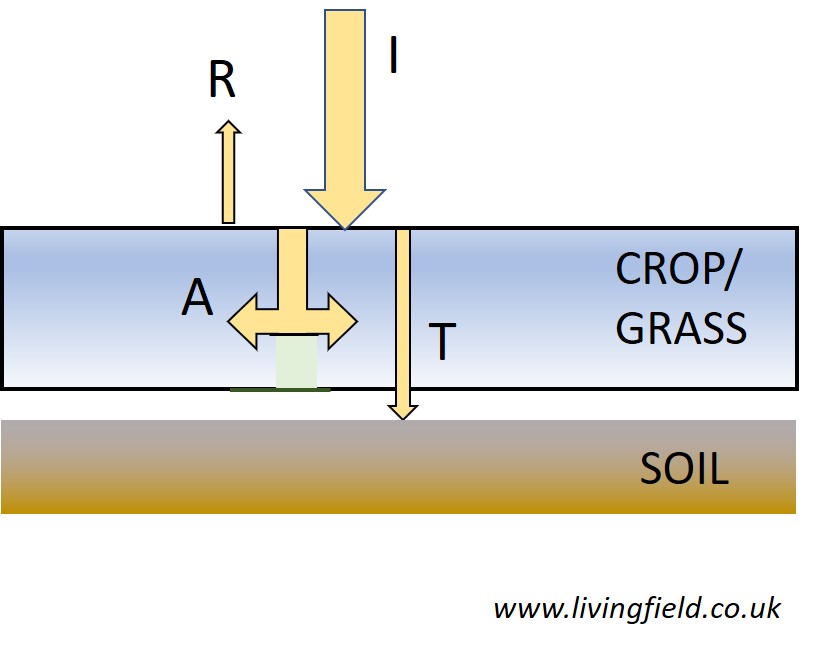
Fig. 1 Diagram of vegetation (crop/grass and trees) and soil, showing incoming solar irradiance (I), and parts of that reflected from the crop/grass canopy (R), absorbed by the canopy (A) and transmitted to soil (T).
The solar radiation absorbed by the canopy (A) is then estimated as I minus R + T. In some studies, further instruments can be located at different heights within the canopy, for example to measure the energy available to each of a tall and short species in a mixed crop, or to trees and the under-layer in agroforestry.
A further simplification is often used when comparing crop performance among species and environments: for this, reflected (R) and absorbed (A) are combined into what it called intercepted radiation [1], which is the amount of the incoming radiation that a crop, grassland or forest prevents from reaching the soil. It is useful short-cut because reflected radiation is not routinely measured and tends to be a small percentage of the incoming.
Intercepted radiation and crop growth
As vegetation starts to grow it puts out foliage that intercepts the incoming radiation. The curve of intercepted radiation with time (expressed as a percentage of the incident) commonly looks like the slanting S-shape in Fig. 2 [3]. In a well managed crop, it can reach a maximum above 90% of the incident, but in environments that are depleted of water and nutrients, the maximum can be little more than 10-20%.

Fig. 2 Diagram of the changes in solar energy ‘lost’ and intercepted as a crop canopy grows from sowing to harvest. Plant drawings by K Owen.
The solar radiation received at the earth’s surface in the early stages of growth is sometime regarded as being ‘lost’ to agriculture. If high yields are the aim, this lost radiation should be minimised. The general methods by which agriculture and forestry attempt to reduce lost solar will be described in later articles.
Conversion of solar radiation to plant matter
The plants use the intercepted radiation to convert atmospheric carbon dioxide to plant material (Fig. 3). By measuring both plant dry matter and intercepted solar, it is possible to estimate how much dry matter is gained for each unit of energy intercepted, shown by the angles (a) and (b) in Fig. 3. The units of the measure are g MJ-1 or grams of dry plant material per megajoule of solar radiation intercepted.
In some types of vegetation the angle (a) changes little throughout growth, but more commonly in crops having a reproductive yield such as grain, oil or nuts, the angle decreases after flowering. There are several reasons why this happens – for example, the flowers and reproductive structures may be less efficient in photosynthesis than leaves, or more energy per unit mass may be needed to form reproductive structures, especially if they contain a high fraction of protein or oil.
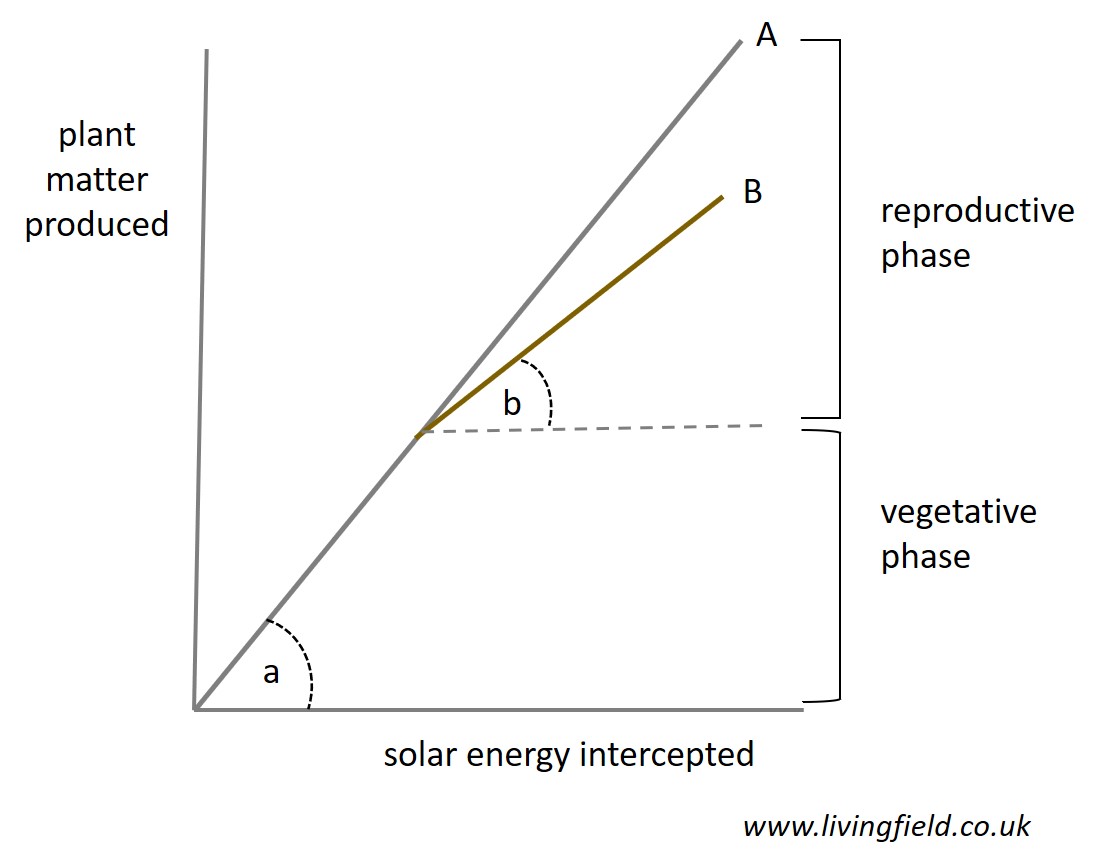
Fig. 3 Diagrammatic relation between solar energy intercepted by a crop canopy and the plant matter produced through conversion in photosynthesis. The angles (a) and (b) show the ‘radiation use efficiency’: (a) during the vegetative phase which sometimes continues unchanged throughout the reproductive phase, and (b) when efficiency decreases during the reproductive phase.
Interception more likely affected than conversion
Studies in a wide range of growing systems and climates have demonstrated that much more of the differences in growth and yield between crops are due to variation in interception rather than conversion.
As will be shown later in this series, temperature and rainfall (or drought) tend to operate mainly through the interception curve in Fig. 2. And conversely, many of the attempts by agriculture to reduce loss or overcome adverse conditions operate by influencing this curve.
The relations in Fig. 2 and 3 are therefore central to understanding climatic effects on food production. The next article will look at the main qualities of plants that influence the interception curve.
Things are more complex?
The approach in Figures 1 to 3 here greatly simplifies the way the parts of vegetation interact, especially in complex canopies consisting of many species. Accordingly, science has developed a range of models and measuring systems that can define the partition of energy between individual leaves and stems of different species growing close to each other.
In some models, for example, the space is partitioned into cubes into which vegetation enters and functions [4]. The cubes gain energy, the plant parts in them absorb some if it, and then a portion of the energy is emitted into the adjacent cubes. Models can account for the fact that green vegetation absorbs more of certain wavelengths than others, so what comes out of a cube containing (say) a leaf is not the same in quality as what went in.
For the most part, this series will be looking at the big leaf or something not much more complex.
Sources / references
[1] Crop production was widely interpreted in terms of interception and conversion of solar radiation by J L Monteith and colleagues at the University of Nottingham, for example: Monteith (1977 ) Philos. Trans R. Soc B https://doi.org/10.1098/rstb.1977.0140. See also [3] for later work at the Microclimatology in Tropical Agriculture unit at Nottingham. One of the valuable outcomes of this work was that much more of the variation between crop types (species, varieties), climates and cropping systems occurred though interception rather than the more stable conversion process expressed as radiation use efficiency.
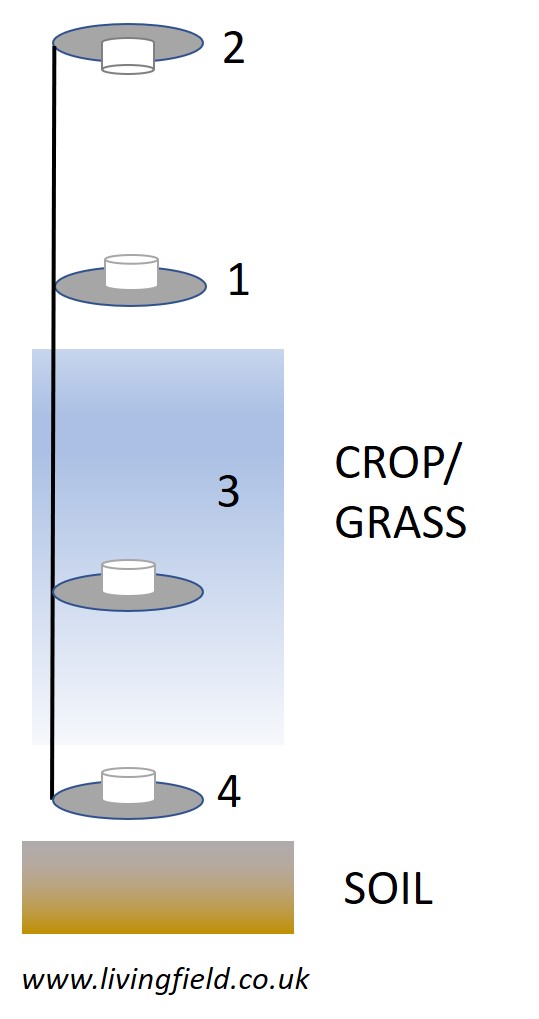
[2] Diagram to show positioning of four solarimeters installed to record (1) incident solar irradiance, (2) radiation reflected from the leaf canopy surface, (4) radiation transmitted to soil and (3) one solarimeter installed to measure radiation absorbed by the plant canopy. Several solarimeters may be located in between the top and bottom of the canopy to measure radiation absorption by different layers.
Examples of commercially available intruments are given at Delta-T Devices and Campbell Scientific. Different types of solarimeter may be used to sense specific wavelengths, such as the photosynthetically active range. Some solarimeters measure energy while other sense quanta.
Absorbed and transmitted radiation are commonly measured by ‘tube’ solarimeters (e.g. 0.5 m length) that take account of spatial variation in radiation or quanta due to variable plant cover. More on this at an Applications Note by J L Monteith dated 1993 published online by Delta-T Devices.
[3] The S-shaped interception curve in Fig. 3 is one of several representations used to describe the course of percentage interception over time. This one derives from work at the University of Nottingham’s Microclimatology in Tropical Agriculture unit active in the 1970s and 1980s: Marshall, Squire, Terry (1992) Journal of Experimental Botany 43, 95-101. The curve is still used in current models of crop growth: e.g. Young, Mullins, Squire (2017). Environmental Science and Pollution Research 24, https://link.springer.com/article/10.1007/s11356-017-9769-8
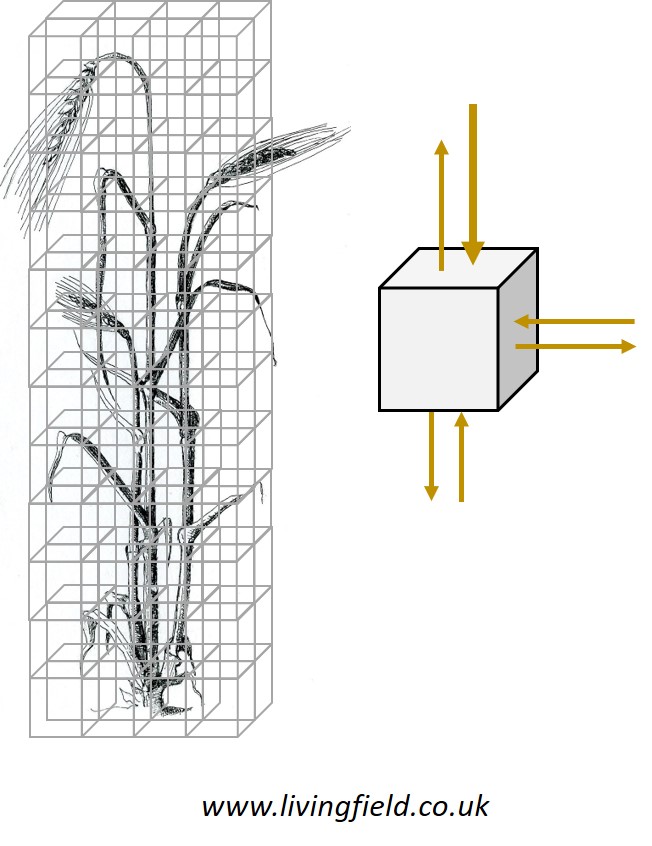
[4] Depiction of the space around a plant or plant canopy divided into cubes: a procedure used in detailed measurement and modelling of solar energy in complex plant assemblages such as crops growing with a range of weed species.
For each cube (diagram right), the models estimate energy or quanta entering and leaving each of the 6 sides – for example, near the top of the canopy, most will enter through the upper side (large arrow).
The plant parts in each cube absorb, reflect or transmit energy or quanta. That absorbed is used to model plant growth. Example reference: Colbach et al. (2021) Field Crops Research 261 https://doi.org/10.1016/j.fcr.2020.108006
Contact / author: geoff.squire@hutton.ac.uk or geoff.squire@curvedflatlands.co,.uk
Thanks K Owen for the drawings of faba bean and barley.