
High annual rainfall in recent decades causing problems for cereal production; timing of rainfall more important than yearly total; much greater yield drop caused by the wet harvest of 2012 than the winter floods of 2016. [An article in the series ‘Winter flood’.]
The last few decades have experienced several of the highest rainfall years since reliable records began in 1910. The effects of perhaps too much water on long term trends in crop yield are being examined and will be reported elsewhere. Yet contrasting years tell us already that problems are not caused by the amount of rainfall in a year, but by the timing of that rainfall.
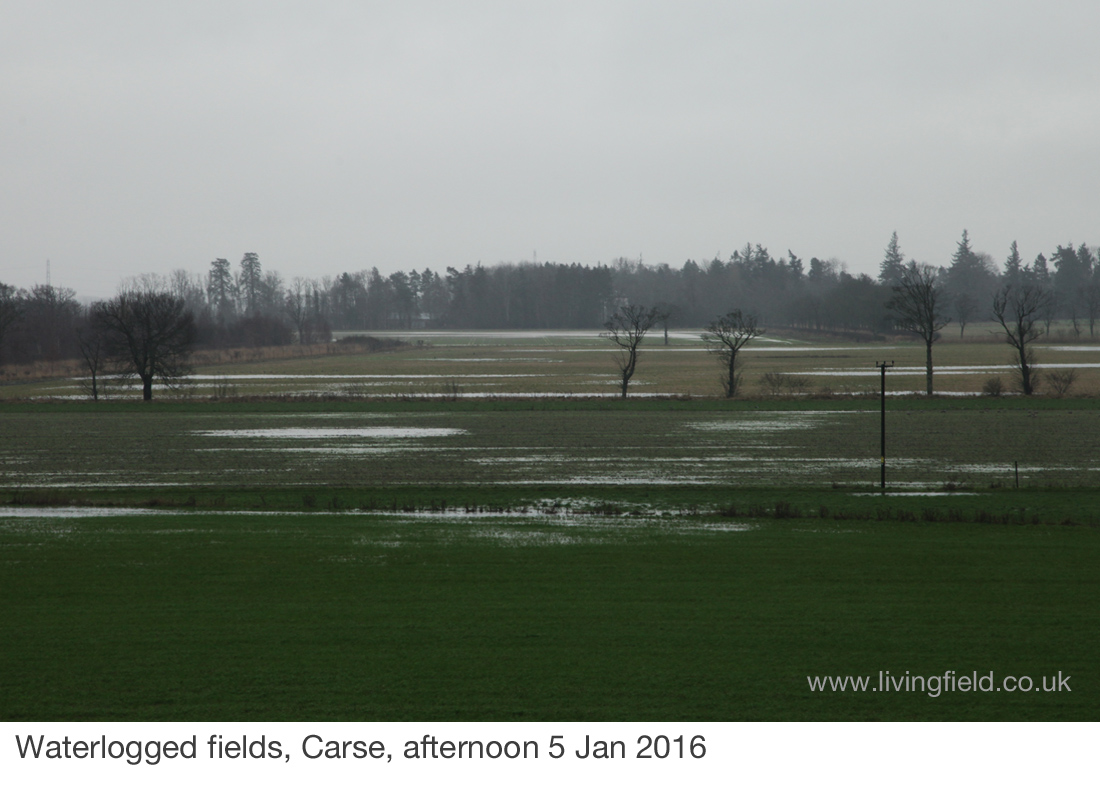
The image above looks south over the Carse of Gowrie in early January 2016, the green cereal (corn) fields and the brown stubble were completely waterlogged, the landscape immersed in dense cloud, hardly any light for photosynthesis in the middle afternoon. (No attempt to brighten the image – this was how it looked.)
Many autumn-sown corn fields grew yellow with the persistent wet, dead patches within them. Yet the final estimates of yield for the harvest years 2016, released in December 2016, give the first indication that the severe flooding the previous winter caused a much smaller loss of yield than the wet harvest of 2012.
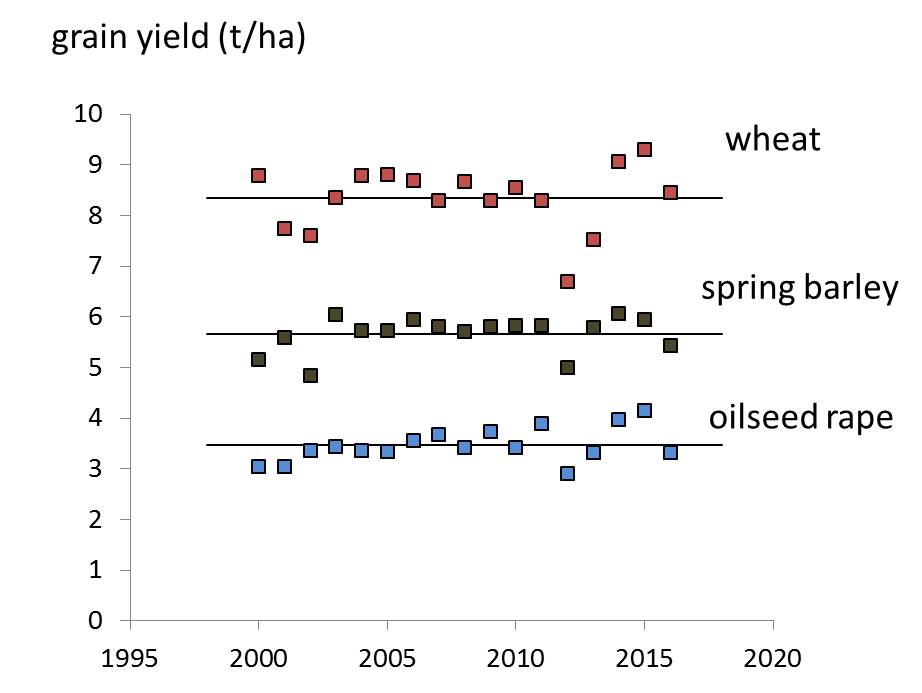
Fig. 1. Grain yield, average for Scotland, for wheat, spring barley and oilseed rape between 2000 and 2016: the first two standardised to 14% water content, the latter to 9%; horizontal lines show the average.
The trace in yield from 2000 (Fig. 1) shows a drop in 2002 for the two cereal crops, then a period of stability up to 2011 followed by a large fall in 2012. Yield partly recovered in 2013, rose well above the average in 2014 and 2015, then dropped back in 2016.
The same data are shown in Fig. 2 where yield of each crop is expressed as a percentage of the average for the whole period (100% line). The large depression in 2012 and 2013 is shown by all three crops as is the recovery and the later drop in 2016. The 2012 depression caused economic losses, but perhaps more important, the large variation between years shows how sensitive modern arable farming is to these slight variations in the weather.
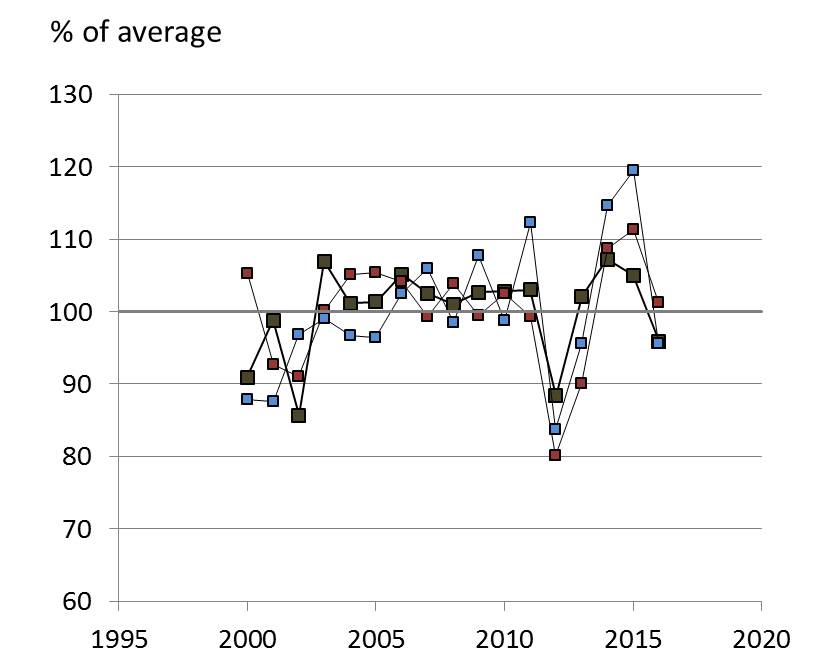
Fig. 2. Grain yield from Fig. 1 presented as a percentage of the average for the period, for wheat (red), spring barley (green) and oilseed rape (blue).
It’s not the total rainfall
The annual rainfall exceeded 1300 mm several times during the period of stable yield between 2003 and 2011, but then the rain generally peaked in the winter. Only about one third of the corn is in the ground at that time (mainly winter wheat, winter barley and winter oat) – the larger area destined for spring-sown barley is still unplanted.
So provided the winter crops are not submerged for more than a few days at a time, they recover and grow to harvest. This happened during the stable phase, for example in 2008 and 2009 when annual rainfall was above 1300 mm.
Why was 2012 yield so poor?
The difference in 2012 and to some degree in 2002 was that rainfall was much higher in summer before and during harvest. In fact, annual rainfall in 2012, at 1287 mm, was lower than that during several years between 2003 and 2011.
It was the wet weather in late summer and autumn of 2012 that caused major loss of yield in the harvest of that year (mostly August to late September). The damage to the ground and to the winter crops just sown or about to be also caused a depression of yield in the next harvest in late summer 2013.
How did 2016 recover?
In contrast, the high rainfall in the winter of 2015/16 set records: in East Scotland December 2015 had the highest rainfall at 272 mm since records began in 1910, then January 2016 also broke all previous records with 266 mm. The result was prolonged waterlogging of fields and severe flooding of some river floodplains, and as stated above, a yellowing of leaf in many winter cereal fields.
Then conditions changed – the spring and summer months had less than average rain, and more than average sun, allowing soils to dry and crops to bulk, such that they yielded at or not much below the the average in Fig. 2.
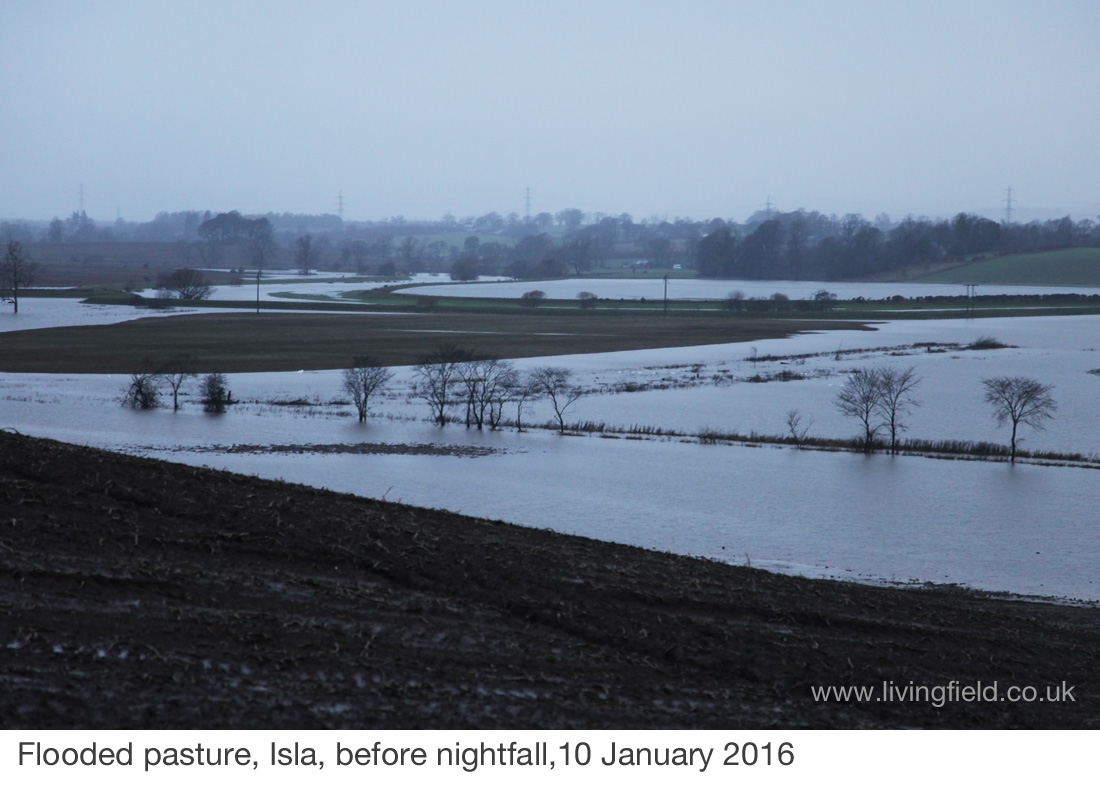
The image above looks north across the Isla floodplain in Strathmore, in dense cloud just before nightfall, the field in the foreground cultivated, sludging and eroding into the river-water. (No attempt to brighten the image.)
Resilience?
The 2015/16 cropping season was testament to the resilience of the crop varieties and their agronomic management to overcome what was unusual weather by our standards. There’s also evidence that farming adapted, perhaps learning from the 2012 floods to shift its cropping patterns and perhaps the fields in which its most profitable crops were placed.
Winter wheat maintained its area between 2015 and 2016, indicating that few fields already sown with this crop had failed by February 2016 to the extent that they had to be resown in March or April with another crop.
But the surprise was the greater production of oats despite the bad winter. The area sown with oat (mainly spring 2016) increased a little, but the yield per unit area increased from 5.92 to a record 6.44 t/ha (tonnes per hectare) and the total production of oat increased by a factor of 1.32, also to a record for recent decades.
So what was going on? The reasons why oats did so well are not clear at present.
Signs of things to come?
The capacity of grain yield to recover from the late summer rain of 2012 and adapt to the winter floods of 2016 shows the soil and crops have kept a certain resilience during this bout of record rain-years.
But the alarming feature of the traces in Fig. 1 and Fig. 2 is the large variation between years caused by what were – compared to weather patterns elsewhere – fairly small shifts in the distribution of rainfall through the year.
The longer term effects of the present rise in annual rainfall are not yet understood. It will be not easy to distinguish the effects of rainfall from the higher temperatures over the same period – and the lower solar income in cloudy summers
More on this in future articles …
Sources, references
Links on this site
Winter flood – pages on the flooding effect of the high rainfall in recent years.
Winter flood …. continued – commentary on the 2012 yield depression
The late autumn floods of 2012 – after the bad harvest
Rainfall
Rainfall since 1910 for UK and regions. Annual and monthly totals are available from 1910 at the Met Office pages for UK and Regional Series. At the Download site for UK and regional datasets scroll down to ‘Year ordered statistics’ and click the download link for ‘Scotland E – Rainfall’.
Winter rainfall 2015/2016. The following Met Office web article gives a summary, with maps, videos and data, of the very wet November to January: Further rainfall and flooding across north of the UK. http://www.metoffice.gov.uk/climate/uk/interesting/december2015_further Jan 27 2016
Cereal and oilseed yields
Scottish Government. Final estimate of cereal and oilseed rape harvest 2016. Downloads are available as pdf and excel files. In the excel download, Tables 2 and 3 give cereal and oilseed rape areas, yield per hectare and total production from 1997 to 2016.
Yields, take from government statistics, are given in tonnes per hectare, t/ha, standardised to a water content of 14% for the cereals (corn) and 9% for the oilseed. Standardising is needed because the grain might be a bit drier in some harvests and a bit wetter in others.
Contact: geoff.squire@hutton.ac.uk