What will be the effect of a one-degree or two-degree rise in temperature? There is no simple answer. The effect will depend on the present climate, the present (and possible future) crops, and the interactions between the two. Some of the main effects of temperature on crops, grass and trees are here examined as part of the background preparation for later case studies.
[Return to Climate and Crops]
Summary
- A plant’s development (or its movement through life history stages) is more strongly affected by temperature than is its growth or accumulation of mass. Development lays out the periods over which growth happens by solar capture.
- Development occurs in a central range of temperature spanning, typically 30 degrees. Below and above that range, development stops and plant tissue can be damaged or killed.
- The annual temperature cycle in northern latitudes determines when development can happen and hence the types of agriculture possible: e.g. short summer grazing or mixed arable-grass.
- In the region under study, crops and grass have adequate time to develop and grow within the central temperature range: a rise in temperature of one to two degrees will not take plants out of that central range and will have small to moderate effects on production, possibly up, possibly down, depending on the properties of the plants.
Development and Growth
When examining the effects of temperature, water and other climatic factors on crops, grass and trees, it is important to distinguish development from growth.
- Development (as used here) is the transition of a plant through its life cycle stages, such as germination, production of leaf and branch, extension in height, flowering, maturation, seeding. For our purposes it is measured in time (days).
- Growth is the increase in living matter (carbon, nitrogen, other nutrients) in various structures. It is usually measured in mass per unit time.
Development (of course) needs some growth to sustain it, but growth can differ enormously among plants have the same developmental timing. The distinction is crucial in our understanding of climatic events and climatic change because temperature has a much greater effect on development than on growth. Examples are given below.
Temperature ranges
In most climates, plants experience a wide range of temperature. They develop and grow over a central range shown by A to B to C in Fig. 1. Above A, developmental rate increases (time per stage decreases) until time reaches a minimum at B, above which it again increases to C, where it stops. Below A and above C, plants enter ranges (D-A) and C-E) in which development stops but plants are not usually harmed. Below D and above E, at the extreme ends of the range (F-D and E-G), conditions may be so severe that plants are damaged or killed.
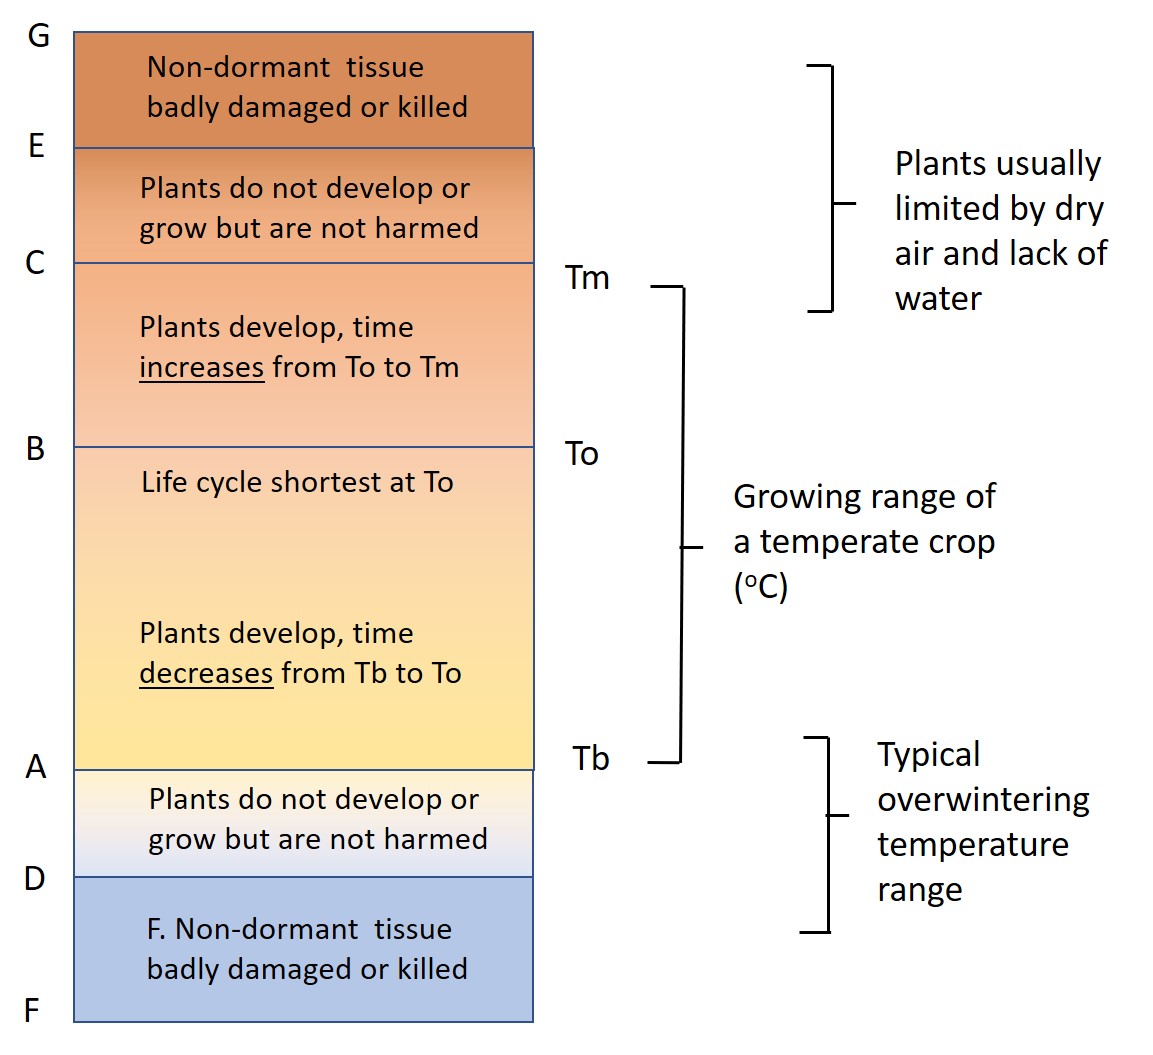
Fig. 1 Temperature ranges (simplified) for temperate crops: A to B to C is the range over which development happens; D-A and C-E are too cold or hot for development but plants are not generally harmed; in FD and EG, dormant tissues might survive but non-dormant will be harmed or killed. In plant physiological work, A, B and C are named the base temperature (Tb) and the optimum (To) and maximum (Tm) temperatures for development.
Complications …
Plant species differ as to the actual temperature limits of the ranges in Fig. 1, but the range of A-B typically spans 15 to 20 degrees and that from B to C, another 15 degrees. Many agricultural plants can therefore develop over a total range of 30 to 35 degrees. But as the seasons progress, taking temperature through the ranges in Fig. 1, further complications arise.
First, other limiting factors enter at the lower and upper ends of the range A to C. At the lower end, excess precipitation in some areas may cause waterlogged soil, which itself can limit plants and agronomic operations. At the upper end, a lack of rain can make it more difficult for plants by reducing the water available to them in the soil. The high temperature itself also increases the dryness of the air, causing higher potential evaporation – and if plants cannot meet that evaporative demand, their leaf temperature will rise.
Second, the state of dormancy is crucial. There is less chance of a plant being harmed by cold or heat if it is in a dormant state – for example, as a seed in the soil or an over-wintering bud. Most plants in leaf can be harmed by very low temperature, but modern cereals and most grasses and conifers can tolerate temperatures less than -10oC if the plant is not actively developing and has had the opportunity to get used to the cold. Much greater harm can be done if plants experience a sudden and large rise or fall in temperature while they are in rapid development (in the range A to C). Plants in flower are particularly sensitive to sudden heat and cold.
Third, the temperature of developing plant structures can be different from met site temperatures (usually measured in above-ground screens). For example, roots and tubers in soil experience a smaller annual range than foliage above ground, while in hot dry conditions leaves, flowers and fruits can be several degrees warmer than the air.
Models and predictions of climatic effects on agricultural yield has to account for all these complications.
Annual cycles
Unlike in warm monsoonal climates, temperature in north temperate regions goes through a large annual cycle, related to variation in solar income [1] and air movement [2].
Three examples are given in Fig. 2 where three temperature cycles have been superimposed on the ranges in Fig. 1 [3]. Plants developing in the lower cycle, labelled ‘too cold’, may be harmed if developing in the range FD, remain inert in DA and develop only for the short period spent in AB. Plants in the upper one, ‘too hot’, spend much of their time active in the range AC but spend for some months in CE and EG where they may suffer damage or death. In the central one marked ‘just right’, plants spend most of the time passing through their life cycle in AC.
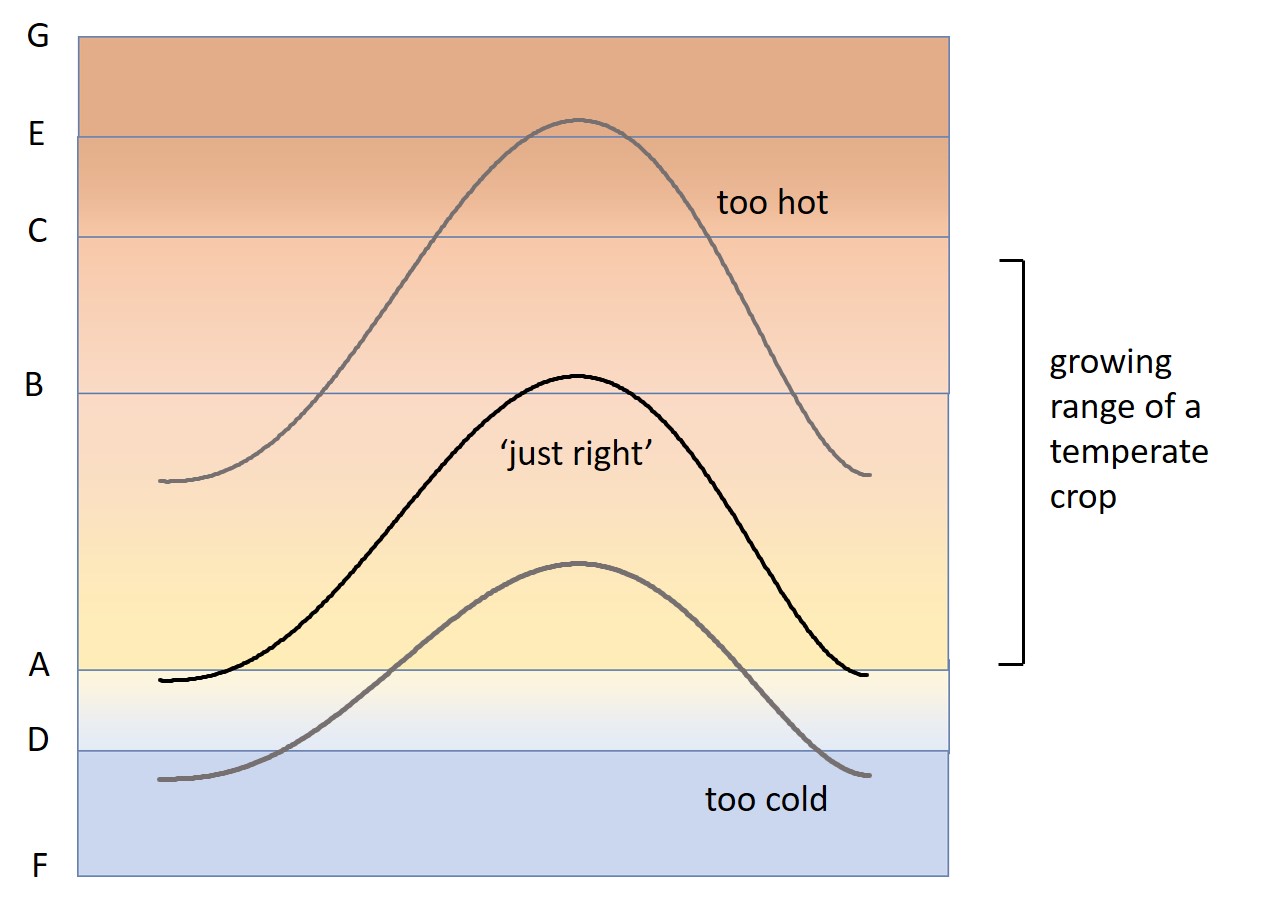
Fig. 2 Temperature ranges from Fig. 1 with three (hypothetical) annual cycles of air temperature. In an ideal climate for crops and grass, temperature cycles between mainly A and B.
While these three curves are used for illustration, they do approximate real climates. The lower one does not allow enough time in the developing/growing range for an arable crop to be sown and harvested, but it could support a short-summer-pastoral agriculture. The upper one allows development and growth early and late in the year but stops developing in between. Some Mediterranean climates are like this – crops grow over the winter and have to be harvested before high summer.
The central one can be found in large areas of Atlantic zone Erope, including northern, lowland Britain. It is ‘just right’ to support a mix of arable cropping and grass.
Time and 1/time
Studies on the effect of temperature on plant development between limits A and C tend to observe a U-shaped curve as in the left hand side of Fig. 3. Plants begin to develop, e.g. germinate, produce leaf or flower, when temperature rises above the limit A in Fig. 1. As temperate rises from A to B, the time to develop gets less until it reaches a minimum at B. With further rise in temperature, time increases.
The temperatures at which development starts or stops and reaches the minimum need to be known for modelling and predicting the effects of climatic shifts. The problem with the U-shaped curve lies in defining the exact temperatures at which development stops at A and C. In some studies, it takes so long for plants to develop when close to A and C that they never make it – they die from other causes. However, if the reciprocal of time – or 1/time – is used then the temperatures at which development starts or stops can be approximated, by extrapolating the straight lines in the right hand part of Fig. 3 [4].

Fig. 3 Diagrams to show the effect of temperature on (left) time for development (individual stages or the whole life cycle) and (right) the reciprocal of time or 1/time [4]. It is difficult to define Tb, To and Tm from the left hand depiction, mainly because time increases to very high values near Tb and Tm.
Rather than refer to the limits A, B and C as in Fig. 1, studies of the temperature-responses of agricultural plants [4] tend to name the lower limit the base temperature (Tb), the upper limit, the maximum temperature (Tm), and the point at which time is least (1/time largest) the optimum temperature (To). Equations fitted to the lines in Fig. 3 right define the thermal time or thermal duration required for a stated developmental process [5].
Why this is important for climatic events and climatic change
Returning now to the original question of what a small rise in mean temperature would do to agricultural production! A rise would be good for agriculture in the lower ‘too cold’ climate in Fig. 2: it would extend the number of days in the year when temperature was above the base temperature (Tb). It might allow a hay crop to be grown, cut and dried, or even a short-season arable crop. In contrast, a rise would be bad for the upper climate, increasing the days spent in the killing range.
But what about the middle climate? As it is, plants spend most of their time on the decreasing part of the curve (Fig. 3 right) below To, and also a little of their time beyond To. A small increase in temperature would mean plants spend more time above To, but in general development timing would not be strongly affected.
Relevance to Scotland’s climates and crops
The main purpose of this article give some background to questions around the effect of climatic warming on plant production. It will be used to inform case studies presented later in the year. Some general comments are given at this point.
The exact limits of development defined by Tb (etc.) are not the same for all crops and grass, but for temperate crops such as oats, wheat and barley and many temperate grass species, Tb is typically around 0oC, while To will be around 20oC. The upper limit, Tm, is probably 30 to 35oC, but difficult to define in field studies because air temperature above 25oC is usually accompanied by lack of moisture which additionally limits growth.
Where then do the climatic regions of east and west Scotland fit? The lowest average monthly air temperature over the last 30 years lies between -1 and 1oC, while the highest is around 18oC [6]. The values can be higher or lower in individual years but in most years, the mean monthly temperature varies over a 20-degree range but stays mostly between Tb and To for temperate crops and grass.
The climates here might therefore be considered among the ‘just right’ in Fig. 2. Plant development and the consequent production and yield differ between years, but on average, yields in the east and west Scotland climatic regions are the highest in the UK. It is here that life cycle timing and solar income make a near-ideal combination called the Long-cool-summer effect (to be examined later in a separate article).
The discussion above has dealt mainly in long-term average temperatures, but it’s the extreme weather events that give problems but also the best insights. Some events such as the hot, dry 1976 will be examined in the third part of this series on lessons from the recent past.
Sources | References | Links
[1] Living Field articles in this series on Solar income and Solar capture.
[2] In progress
[3] The three annual temperature cycles used for illustration in Fig. 2 are re-shaped versions of one curve. The original is derived from the Met Office’s UK and Regional Series https://www.metoffice.gov.uk/research/climate/maps-and-data/uk-and-regional-series, values for the west Scotland region (map available at the link). Also, see [6].
[4] Physiological studies of plant development and temperature have a long history. The basis and use of Tb, To and Tm was formally presented by Garcia Huidobro, Monteith and Squire (1982) Journal of Experimental Botany 33, 288-96.
[5] Growing periods have sometimes been defined as a thermal time or ‘growing degree days’ accumulated above a base or threshold temperature, which has sometimes been assumed rather than measured. The author prefers the more formal approach in Fig. 3 right, where any developmental process (germination, leaf production, flower production) is assigned a thermal duration measured in degree-days between a specified Tb and To.
[6] Temperatures referred to here are from the Met Office’s UK and Regional Series https://www.metoffice.gov.uk/research/climate/maps-and-data/uk-and-regional-series. Data are based on the HadUK 1 km grid and averaged by month across UK regions. Those referred to here are maximum, mean and minimum air temperature for East and West Scotland regions. Gridded averages are a valuable, broad indicator of climate but obscure high or low temperatures that might have damaging effects.
Author/Contact: geoff.squire@hutton.ac.uk or geoff.squire@outlook.com