Copernicus remote sensing – 2022 drought

Copernicus is a scientific Programme of the European Union – “Europe’s eyes on earth – looking at our planet and its environment for the benefit of Europe’s citizens” [1].

The Living Field frequently used data and images from the Copernicus Programme to inform and illustrate various articles on weather and climate in 2021 and 2022. Their coverage of major climatic and land-based events throughout the world gives some perspective and wider context to what is happening in Scotland’s arable-grass.

Image of the Day

Copernicus publishes an Image of the Day, which usually shows an environmental state or change of state in a defined region of the world – a serious flood, a melting glacier, wildfires, drought and high temperature, for example. If you sign up for it – Copernicus emails its images with a brief description and a link to their web site which holds the full resolution image and description [1].

The images provided by the Copernicus remote sensing satellites are free to view and download and to use with reference to the original source. Several of the images have been uploaded to the Living Field web to illustrate articles on weather and climatic shifts.

Here we show four examples of the Copernicus Image of the Day. They are among many that document the severe heat and drought affecting vast tracts of the earth in 2021. Text in inverted commas is taken directly from the Copernicus web site. 

Land Surface Temperature – Greece and Turkey

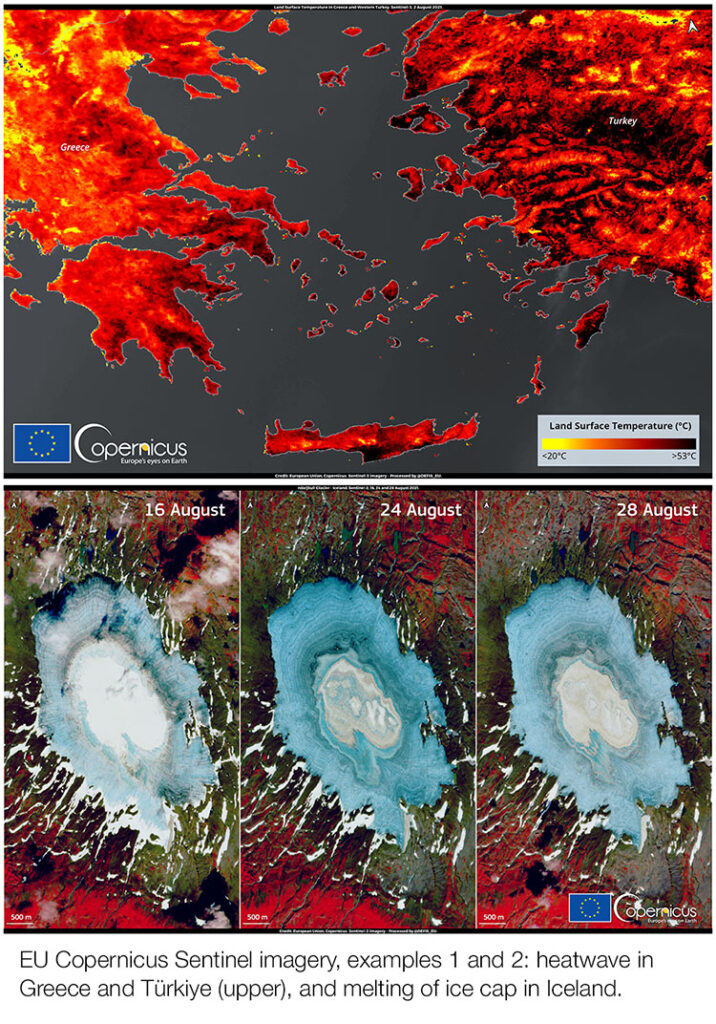
European Union, Copernicus Sentinel-3 imagery: Heatwave in Greece and Western Republic of Türkiye. Image of the Day 3 August 2021

The image, the first of the pair above, was created from measurements by radiometer on one of the Copernicus Sentinel-3 satellites on 2 August 2021. Summer temperature was extreme in Greece and western Türkiye – air temperature of 42°C at noon in Peléponissos and further south on the island of Crete; 46.3°C in Makrakomi, Greece; and 44°C along the coast of Türkiye. In hot dry conditions, soil temperature is usually higher than air temperature. The map shows soil temperature surpassing 53°C in some areas.  The original image can be found here

Melting of ice cap in Iceland

European Union, Copernicus Sentinel-2 imagery: Massive melting of the ice cap in Iceland. Image of the Day 30 August 2021.

The three images (example 2) “acquired by the Copernicus Sentinel-2 satellites on 16, 24 and 28 August provide evidence of the massive melting of Iceland’s ice sheets following the heatwave that has recently affected the island.“ The images show the Þrándarjökull glacier before, during and after the summer heatwave revealing a visible “shift from a situation of partial snow cover on the top of the ice sheet (on 16 August) to complete exposure of the older ice layers (on 28 August). Original here

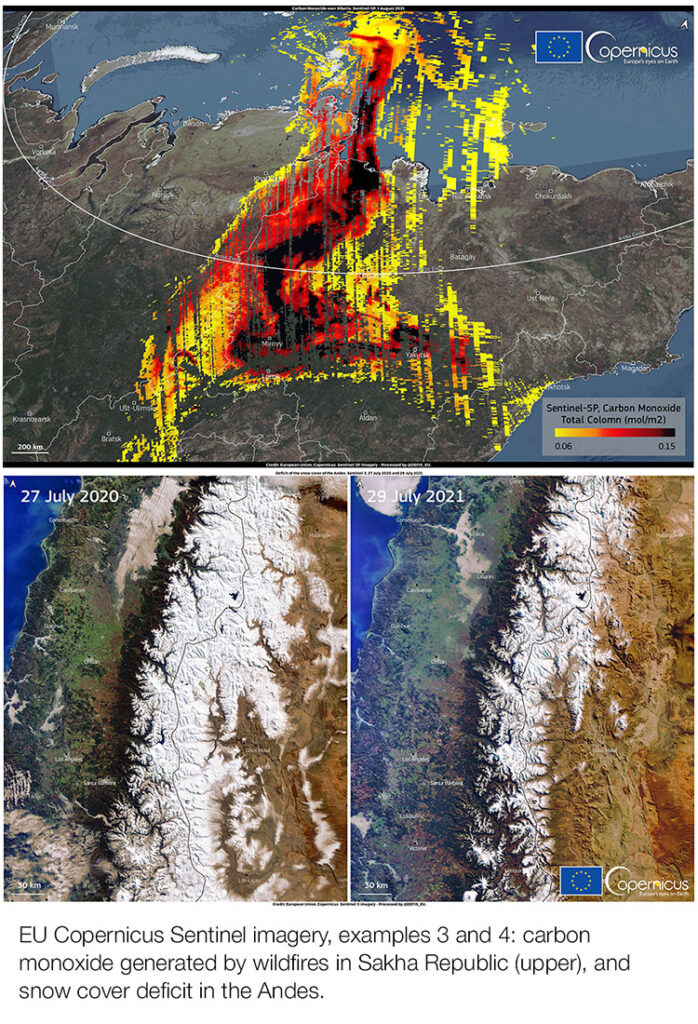
Carbon monoxide (CO) in Sakha following forest fires

European Union, Copernicus Sentinel-5P imagery: Carbon monoxide generated by the wildfires in Sakha Republic (Russia). Image of the Day 1 August 2021

In summer 2021, Siberia experienced a severe fire season, “almost 500,000 km2 burnt by the end of July 2021. As a result of the fires, CO (a potent greenhouse gas) has reached values of 0.15 mol/m2, nearly twice as high as those recorded in 2020″. This image (example 3) shows the CO concentration in the Sakha Republic retrieved from data collected on 1 August. “The TROPOspheric Monitoring Instrument (TROPOMI) onboard the Copernicus Sentinel-5P satellite allows CO levels to be measured at an unprecedented level of detail on a global scale.” Original here.

Snow deficit on the Andes mountain range South America

European Union, Copernicus Sentinel-3 imagery: Snow cover deficit of Andes. Image of the Day 2 August 2021

In the winter of 2021, the Andes was affected by a severe drought. The reduction of snowfall (example 4) on both the Chilean and Argentinean sides of the range was made visible by data from by one of the Copernicus Sentinel-3 satellites. The images show snow cover on 27 July 2020 and the marked reduction visible one year later, 29 July 2021. Original here.

Past images?

The Copernicus web site holds a bank of past images. To see them, go to Image of the Day [1], scroll down a little and click the current Image, then click View Gallery and the images are provided in date order for download at high res.

Further analysis combining satellite and ground data

Satellite imagery provides a snapshot of the earth’s condition depending on the sensors deployed at the time, but the data in the images can be combined with other spatial information to estimate various threats or risks, to agriculture, wildlife and water supply, for example.

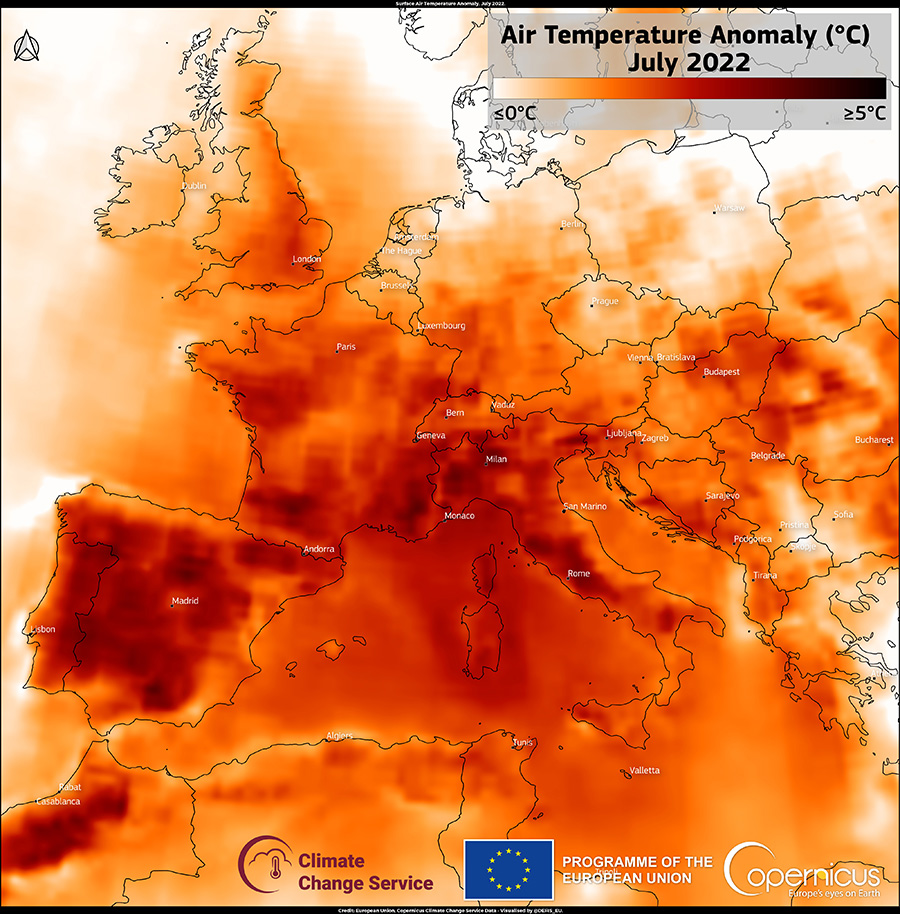
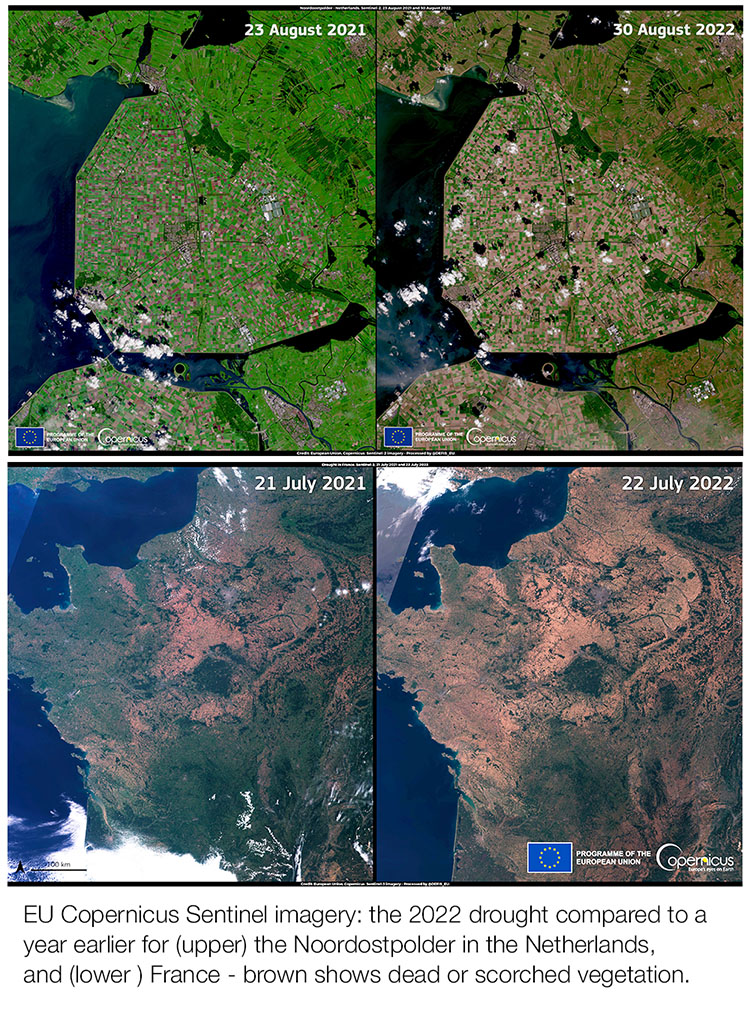
The advance of severe drought in Europe during summer 2022 was followed by such analysis. The Sentinel 2 and 3 satellites recorded change in the colour and cover of vegetation, as in the examples above for the Netherlands and France, but change in vegetation by itself does not allow definition of the cause. Similarly, below-average rainfall for some weeks or months does not necessarily mean that vegetation will be suffering from drought.

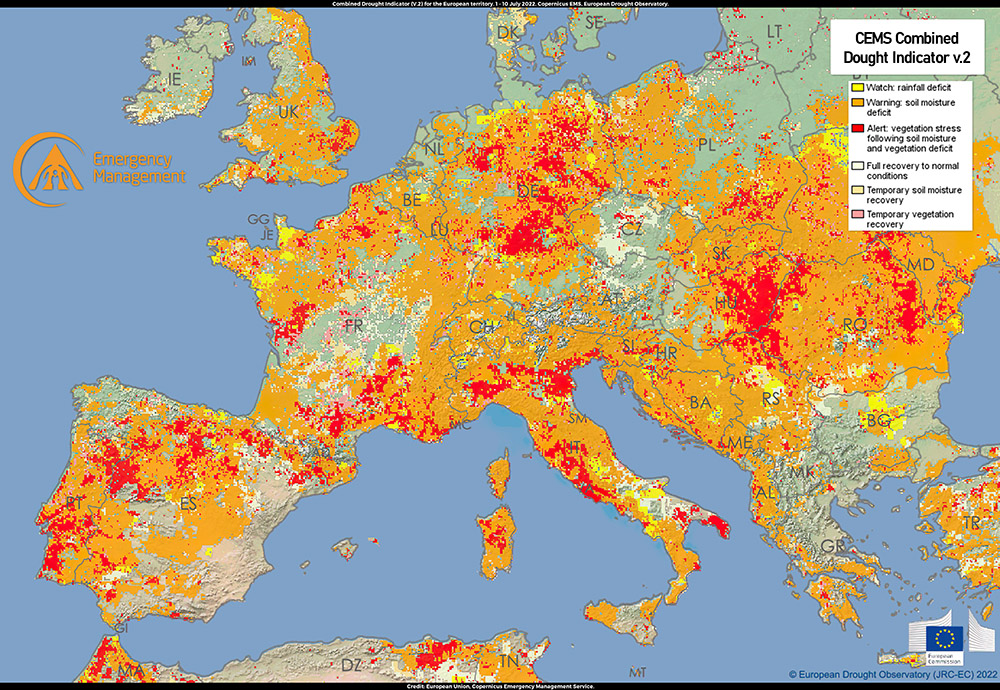
The assessment of drought by combining several measurements and models is carried out by one arm of Copernicus – the European Drought Observatory, EDO [2, 3]. First, data on rainfall submitted by national met. organisations are analysed in relation to long term averages. If rainfall drops below a certain limit, a ‘Watch’ level is issued. Second, a model of water use and movement (a hydrological model) estimates the status of water stores in the soil and surface waters. If these fall below a defined limit then an area comes under ‘Warning’ status. Third, the state of vegetation in terms of its capacity to photosynthesise (take in carbon dioxide from the air to make plant matter) is assessed through fAPAR (the fraction of Absorbed Photosynthetically Active Radiation). The measure of fAPAR is provided by sensors on the European Space Agency’s ENVISAT. If the rainfall, soil water and fAPAR measures are all outside set limits, then EDO classes the situation as ALERT.

The three indicators have to be aligned with each other, a process that involves estimating each on a spatial grid (5 km side). It’s a highly complex process that depends on cooperation across many agencies.

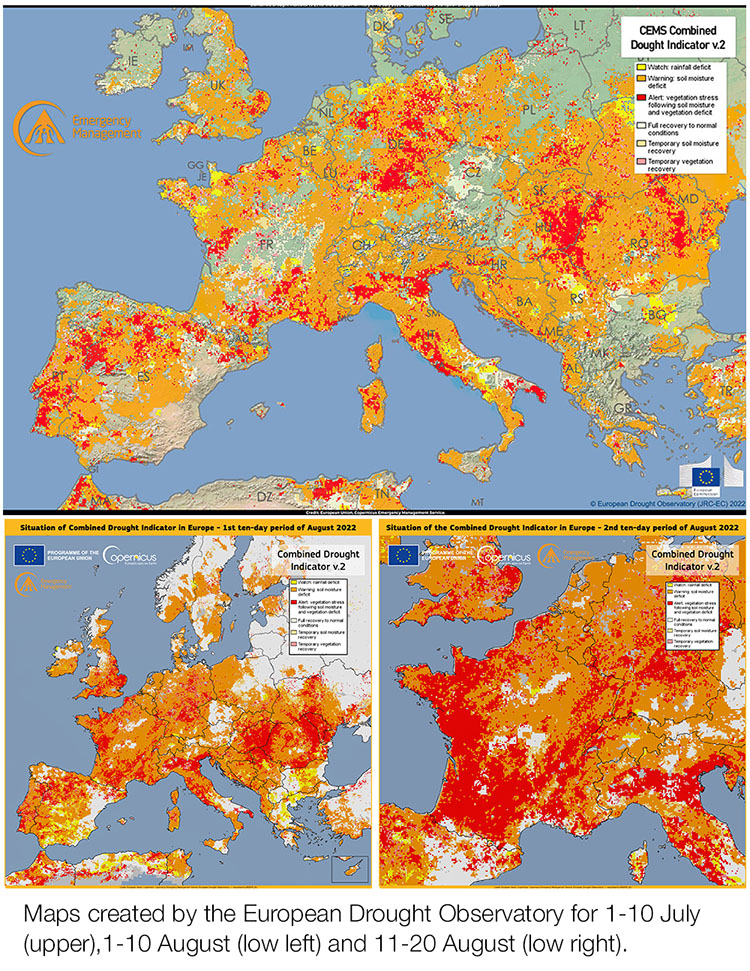
Examples are shown in the set of three images above. The upper one, for the period 1-10 July (Image of the Day for 27 July) showed drought building due to the low rainfall in spring and summer. Much of Europe was in Warning (orange) while several areas were already in the most severe category (Alert, red). The arable-grass of east and central Scotland, though not visible on. the map, was in Watch (green) or Warning .

A month later, 1-10 August, lower left (Image of the Day for 24 August), large areas were in Alert or Warning condition – while most of lowland Scotland was in Warning. Ten days later (lower right, Image of the Day for 8 September), drought had become very severe across large tracts of land, notably in western France..

The value of such analyses by EDO and Copernicus more generally is that they offer a broad picture that helps place your own area in context. Assessing drought across a wide region such as Europe enables forecasting and planning on a large scale, specially important where rivers cross national boundaries and food supply depends on agricultural production in other countries.

Sources | Links

[1] EU Copernicus, main web site: https://www.copernicus.eu/en Copernicus Image of the Day – view the images and sign up.

[2] European Drought Observatory (EDO) an arm of the Copernicus Emergency Management Service: main web site with links to methods, reports and current status. An EDO Indicator Factsheet gives an accessible summary of the Combined Drought Indicator and its three components. Full citation: European Drought Observatory, EDO (2020): EDO Combined Drought Indicator (CDI) (version 1.4.0). European Commission, Joint Research Centre (JRC) [Dataset] PID: http://data.europa.eu/89h/e83b19ce-08c2-4e0c-b93a-5fd62be21e5e

[3] Finer detail of the Combined Drought Indicator is given in a scientific paper: Sepulcre-Canto G, Horion A, Singleton A, Carrao H, Vogt J (2012) Development of a combined drought indicator to detect agricultural drought in Europe. Natural Hazards Earth System Science 12, 3519-3531, doi:10.5194/nhess-12-3519-2012.

[4] Drought in Europe reports from the EU’s Global Drought Observatory. Here is the one for July 2022. Contains many maps of land and met. conditions for the period in question.

Ed: The Living Field acknowledges with thanks the free services provided by EU Copernicus.

Last update: minor edits, 21 Jan 2023.

2022 summer drought

Low spring and summer rainfall 2022. Severe drought and fire risk over many areas of Europe including southern England. East Scotland rainfall lower than average but similar to 1976, 1984, 1995, 2003 and 2018. Implications for agricultural output and water supply.

Yes, Living Field country has been drier than average this spring and summer …. but not so hot and dry compared to much of continental Europe and England. First, the broader picture ….

EU Copernicus image of the day for 9 August 2022: data from Copernicus Climate Change Service [1].

Europe dry and burning

The map above, the EU Copernicus Image of the Day for 9 August 2022, shows the air temperature anomaly (difference from an average) for July 2022. The higher-than-average temperatures shown in shades of deep red are greatest in Spain and Portugal and parts of France and Italy, but the high temperatures extend to Britain and Ireland. Only parts of north Ireland and north and west Scotland were close to the average.

Prolonged dryness and heat increase the risk of fire in forest, moorland and scrub. The risk is now in the highest category in some parts of Europe as shown by the map below, released as the Copernicus image of the day for 19 July. The “numerous major wildfires (are) fueled by extreme heatwaves and pre-existing drought conditions. The total area burned in France, Spain and Portugal in the past 10 days exceeds 40,000 hectares.”

European Union, data from the European Forest Fire Information System (EFFIS), Copernicus image of the day 19 July 2022. Wester Europe ravaged by wildfires in 2022: shown in this visual based on data from Copernicus satellite imagery [1].

“The European Forest Fire Information System (EFFIS), one of the modules of the Copernicus Emergency Management Service, provides daily fire danger forecasts based on a Fire Weather Index (FWI). As shown in this image, the EFFIS FWI forecast for today, 19 July 2022, shows ‘Very Extreme Danger’ of fire – the highest level of risk on the ECMWF/FWI scale – in Spain, France, Italy and the United Kingdom.”

Drought

Prolonged lack of rainfall, high temperature and the associated high evaporative demand lead to shortage of water for people and agriculture. Drought conditions are particularly severe this year by the early and intense heatwaves that affected the continent at the beginning of Summer 2022.

“This visualisation (below) based on data from the European Drought Observatory (EDO) of the Copernicus Emergency Management Service (CEMS), shows the Combined Drought Indicator values during the first decade of July 2022. According to this data, 45 per cent of the European territory is in “Warning” conditions, while 13 per cent is in “Alert” conditions.”

The Combined Drought Indicator is derived from three measures based on remote sensing applied to known ground conditions: incoming rainfall, soil condition (including factors such as water holding capacity) and the vegetation’s ability to intercept and absorb incoming solar radiation (reduced if vegetation is stressed and scorched). The method and the significance of these warnings are explained in a report from the European Drought Observatory [2].

The presence of so much land under drought has reduced levels in the main rivers and reservoirs and will cause widespread yield reduction and in some areas total crop failure.

European Union, Data from the European Drought Observatory EDO of the Copernicus Emergency Management Service. Copernicus image of the day 27 July 2022 [1].

UK divided

In Britain, severe drought and high fire risk have developed mainly in parts of south and east England. Two of the maps above omit most of Scotland, so (we ask) what is happening in Living Field country, especially since water bans have just been issued for some areas?

Original map and commentary at Met Office web site: Driest July in England since 1935 [3]

The Met Office summary for July [3, map right] shows a major north-south gradient. Rainfall is slightly above average in the north and north-west of Scotland, as much as 50% below average in south-east Scotland and northern England but then decreasing to a severe 20% or lower in southern England.

There is more rain the the north than the south in most years but the variation in 2022 is extreme.

Rainfall in Scotland 2022

The Living Field earlier previously published rainfall data for Eastern Scotland comparing the dry 2018 with previous dry years based on daily rainfall records from the Had-UK series [4]. The following is an update as far as the end of July 2022.

Between 1 March and the end of July, the Eastern region had received about 200 mm of rain or half the 30-year average rainfall, but the Northern region was close to the average and the Southern (which includes all the south-west) not far off (Fig. 1). Compare these with the very low rainfall in the South-East England.

Fig. 1 Cumulative rainfall from 1 March 2022 for the Met Office regions of Eastern, Southern and Northern Scotland and South-east England. Original data: Met Office Hadley Centre UK Precipitation [4]. Vertical lines show the quarter and cross-quarter days.

The rainfall in South-east England was very low after the summer solstice – that’s from the third week of June – which is also the time of highest annual temperature and evaporative demand. And it is also often the time of highest human demand.

The effects of the drought on agriculture will depend on the timing as well as the amount of the rainfall. The graph below (Fig. 2) compares 2022 with dry summers in 1976, 1984 and 2018. The years differ mainly in the timing of rainfall between the spring equinox on 21 March and the second cross quarter day (XQ2) in early May.

By the summer solstice (21 June) the totals received were similar, between 150 and 200 mm and remained similar up to the third cross quarter day (XQ3) in early August. Other dry years such as 1995 and 2003 were also similar to those shown.

Fig. 2 Cumulative rainfall from 1 March for the Met Office region East Scotland in dry years 2022 (heavy black line), 2018 (purple), 1984 (red) and 1976 (light blue). Original data: Met Office Hadley Centre UK precipitation [4]. Vertical lines show the quarter- and cross-quarter days.

Effect on agriculture

The severity of drought and heat in southern England and much of mainland Europe will certainly depress yields of many crops. It’s already evident that olive oil will suffer serious losses in much of Spain for example.

The extent of yield loss in the wheat-growing areas of England will not be confirmed until harvest records are complete. The drought is so widespread however that crop production will suffer across the EU and well beyond, adding to the pressures due to reduced exports from Ukraine.

Scotland’s arable and grassland is likely to be much less affected than many other regions. The dry summers of 2018, 2003, 1995 for example caused little reduction in grain yield. The croplands here have been more severely affected by excess rainfall, as in the wet 2012.

Based on previous experience, the pattern of accumulated rainfall this year should not cause a major depression of cereal yield (barley, wheat and oats). The soil received a reasonable amount of rainfall up to the second cross-quarter day in early May (XQ2) . A crucial time for crop growth is between XQ2 and the solstice when crops and grass are either bulking (if overwintered) or forming their leaf and root systems.

Provided the cereals in lowland Scotland have formed their root system, and can set and start filling grain within a few weeks after the solstice, then low rainfall in later July and August will cause relatively little suppression because the roots will be exploring deep in the soil and the grain is maturing and drying.

In contrast, crops such as potato and vegetables that consist of a large percentage of water at harvest will suffer more. In dry summers, these high-value crops are typically irrigated up to harvest but abstraction – the removal of water from rivers and groundwater – is likely to be regulated this year.

Effect on water supply and aquatic ecosystems

By early August, the Scottish Environment Protection Agency (SEPA) reported that water supply in areas of north Fife had moved into the highest category of Significant Scarcity, while most catchments to the east were at Moderate Scarcity [5]. At Significant Scarcity SEPA has the power to temporarily stop abstraction, for irrigation and use by industry, for example. Domestic water supplies are unlikely to be affected since reservoirs in the east of Scotland are still above 70% capacity.

In the UK more widely, the current heat, drought and increased demand for water puts added pressure on a water supply system run by a private sector that many consider to be seriously failing due to water leakages (up to a quarter of stocks) and discharge of raw sewage to rivers [6]. The experience of 2022, especially in the south, should make people realise how fortunate we are to have water on tap in most years.

Human activity takes water from major stores such as reservoirs, from rivers and other surface water bodies and from groundwater through boreholes. From all sources, but particularly from surface water, extraction during drought harms wildlife. Water bodies dry up, connectivity along river systems is broken, food supplies dwindle. It seems too often that wildlife and habitat are down the list of priorities for water.

Sources | links

[1] The EU Copernicus web site provides an Image of the day from which the three maps above were taken. The following links lead directly to the pages for 9 August, 27 July and 19 July. More at the Copernicus Climate Change Service.

[2] Report from the European Drought Observatory: Drought in Europe – July 2022. See also the JRC MARS Bulletin, June 2022 – Crop Monitoring in Europe.

[3] The Met Office web site offers weather summaries, warnings and comment on 2022 and several downloadable time series, e.g. Driest July in England since 1935.

[4] Rainfall data downloaded from Met Office Hadley Centre UK Precipitation – HadUKP Data Download. Ref: Alexander LV, Jones PD. 2001 Updated precipitation series for the UK and discussion of recent extremes. Atmospheric Science Letters doi:10.1006/asle.2001.0025. For earlier posts on the Living Field site: Resilience to the 2018 drought.

[5] Scottish Environment Protection Agency (SEPA) – Water Scarcity Report 5 August 2022.

[6] Environment Agency, 18 July 2022: Water company environmental performance performance hits new low. Ofwat is the water regulator for England and Wales: see for example, 9 March 2022 – Five water companies targeted. The Times 6 August 2022 published an article by Robert Lea – Regulator’s patience with water firms is drying up (digital access free for one month)..