The bere line – rhymes with hairline
Thomas Thorburn used diagrams to get a point across: for example, diagrams in the form of squares to represent large numbers of things. If the reader was no good with figures, then they might get a better idea by comparing two squares of different size to see which was larger and which smaller, and by how much.
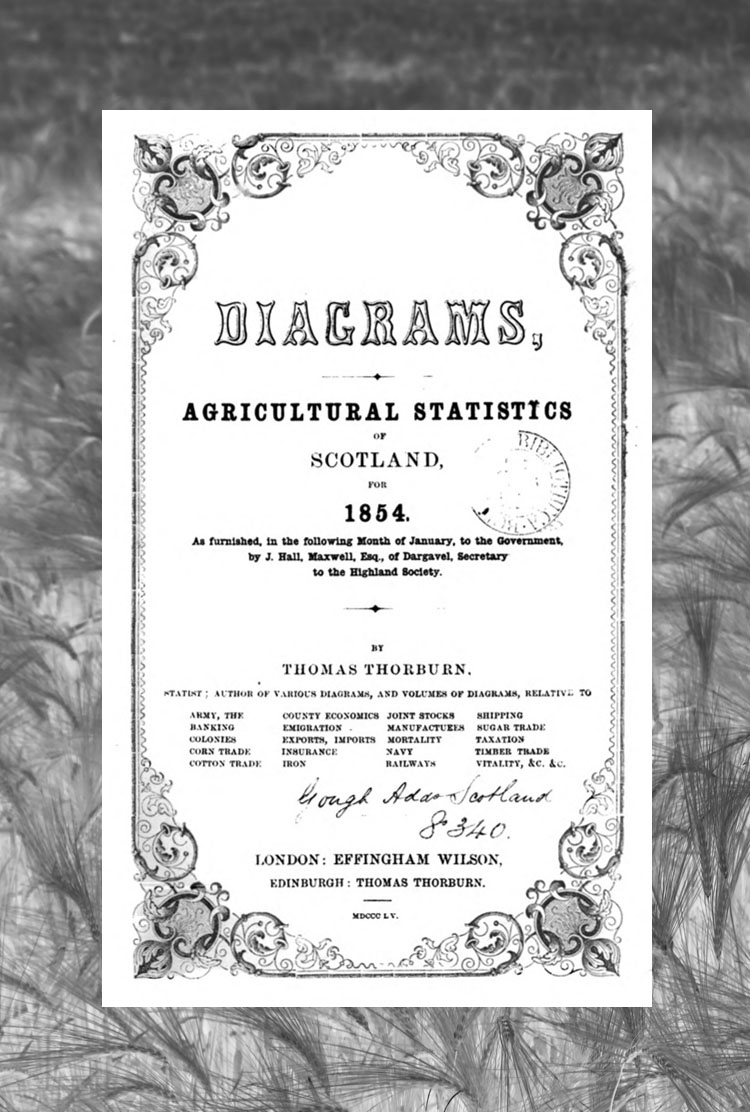
His “Diagrams, Agricultural Statistics of Scotland for 1854” was based on agricultural census data collated by the Highland Society and gives areas grown with various crops and output in total bushels of grain and in bushels of grain per acre, including those for barley and bere.
Bere (or bigg) and barley are clearly distinguished in the pages of Diagrams as different crops.
Summary
The agricultural census in Diagrams tells us much about bere and barley in the 1850s.
- Bere was grown mostly in the north and west, but occurred in most agricultural census regions. Farmers throughout Scotland would have been familiar with it.
- The area in Scotland sown with bere was just less than 10% or one-tenth that sown with barley.
- Yields of barley and bere, when expressed in modern units were both 1.5-2.0 tonnes per hectare (t/ha), compared to present national average yields of 5-6 t/ha for spring barley.
- In Scotland as a whole, bere yields were a bit less than those of barley (about 80% or 90% depending on how yield was calculated), but where they were both grown in the same area, as in some northern and north-eastern regions, their yields were similar.
- Bere has now almost disappeared as a commercial crop, whereas barley is the most widely grown corn in Scotland, going mainly to malting and animal feed.
Where was bere grown in the 1850s?
The area grown with bere in 1854 was about 9% of the area of barley. So in the whole of Scotland, just over ten times more barley was grown than bere. And while most bere was grown in the north and north-east, in places such as Aberdeen, Orkney and Shetland and Caithness, it was grown in a small area in many other places, including areas such as Haddington which are considered to be high-yielding. (The names Aberdeen, Orkney and Shetland, Haddington, refer to census areas.)
Here are some figures. The area grown with bere in census regions was, at the top end, Aberdeen 5322 ac, Orkney and Shetland 2922 ac, Caithness 2710 ac, Argyll 1888 ac; and at the bottom end, Perth 502 ac, Haddington 40 ac and Roxburgh 6 ac. The abbreviation ‘ac’ refers to acre, which is about 40% of the hectare, the present metric unit (1 acre = 0.4047 hectare; a hectare can be visualised as a square of 100 m by 100 m).
For barley, the figures at the top end were Fife 27,938 ac, Forfar 25,222 ac, Perth 23, 710 ac, Berwick 16,576 ac; while figures in the north and west were Orkney and Shetland 149 ac, Caithness 265 ac and Bute 389 ac.
What did it yield
Thorburn gives yield in bushels per acre, bushels being a measure of dry volume, used for grain, and acre being a unit of area widely used until recently, and still used locally. He gives the total bushels produced in each census region (from which bushels per acre can be calculated by dividing bushels by the area of the region) and in a separate diagram, he gives bushels per acre for each region. The two estimates are not always the same, so here we use Thorburn’s bushels per acre figures rather than our calculated figures.
Using standard conversion factors and our estimate of 1 bushel of bere = 21.8 kilograms (see Light on bushel), the national average yield of bere was 1.77 t/ha (tonnes per hectare) and of barley 1.93 t/h, so the yield of bere was just more than 90% (nine tenths) of the yield of barley.
The yields vary between regions, but where both barley and bere are grown together, especially in the north and west, the yields are not that different. In Caithness, for example, barley is 36.0 bushels per acre and bere 36.5 bushels per acre.
Caution
In Diagrams as it appears online, there is no description of the methods by which the census was conducted. It is presumed the Highland and Agricultural Society of Scotland did the work and handed the information to Thorburn who constructed his diagrams.
The yields of crops would have been difficult to measure consistently in the field or on the farm. Harvested grain differs in water-content depending on the weather, the locality and the variety of the crop. And grain also will differ in how ‘clean’ it is , how free of the bits and pieces of plant material that may be harvested with it. Today, yields reported in the annual census are given to a stated water content; so if the actual content measured in the combine harvester or in the grain store differs from this stated content, then the mass has to be corrected to allow comparison of near-dry mass between fields, farms and regions. No indication is given in Thorburn of how the dryness and cleanliness of the grain were standardised across regions.
The way the bushel was measured also probably varied. Perhaps some farms used a standard bushel measure (e.g. a barrel or basket) whereas others might have used a container, such as a cart, that they knew held a given number of bushels.
And then the areas sown with the crops were stated very precisely, sometime to several hundred thousand acres and three quarters. But were all fields measured so precisely? What if crops were grown in strips or parts of fields – was the area grown with each strip or part measured? It is difficult today to measure accurately the area of all fields in Scotland sown with a particular crop – and that is with all the official demands to record what was grown where and when.
Despite these uncertainties, the census was a major achievement. It must have taxed the Highland Society’s officials and local organisers. And they probably did have a very good appreciation of areas and outputs. But in some regions they appear to have come up against difficulties that were too great – for example, the yield of bere in Orkney and Shetland is omitted from Thorburn, despite much bere being grown there.
Sources and References
Thorburn T. 1855. Diagrams, Agricultural Statistics of Scotland for 1854. London: Effingham Wilson.
Scanned images of Diagrams appear online, for example through the Bodlean Libraries at the University of Oxford, as in the following pdf file: http://dbooks.bodleian.ox.ac.uk/books/PDFs/590979280.pdf But not all the pages appear to be viewable!
The Scottish Records Association has a page on the Royal Highland and Agricultural Society of Scotland with references to that time:
[http://www.scottishrecordsassociation.org/index.php/archival-summaries/other-institutions/52-royal-highland-and-agricultural-society-of-scotland] Ed: possible issues with this web link, inquiries in progress.
And the following should lead directly to a pdf file on the above:
[http://www.scottishrecordsassociation.org/images/archivalSummaries/SRA004rhass.pdfSummary] Ed: possible issues with this web site, inquiries in progress.
Ps. There is also a recent reissue of one of Thorburn’s books: Diagrams, illustrative of Facts, Principles & Theories. Paperback by Nabu Press, published 2012. [Update: we have now viewed this book in late 2017 and confirm that it contains few statistics about land or agriculture. It covers a wide range of topics in various forms, including line graphs and squares within squares .]
Bere and barley at the Living Field
Links to other Living Field entries on bere and barley can be found at the bear line – rhymes with hairline.
Author/contact for this article: geoff.squire@hutton.ac.uk